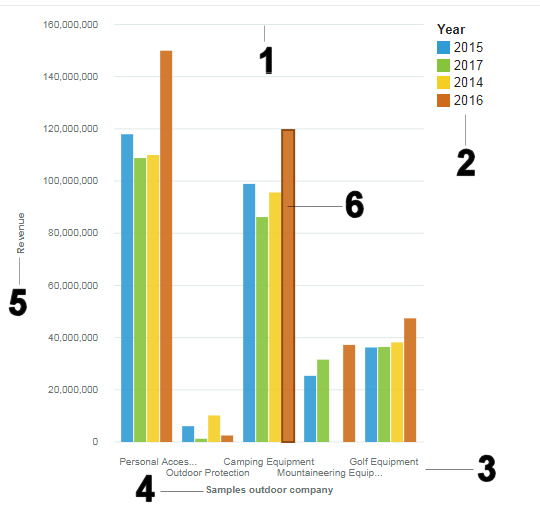
Visualization objects The following shows the most common visualization objects as they appear in your report output in IBM® Cognos® Analytics - Reporting. 1 Grid lines 2 Legend 3 x-axis labels 4 Title 5 y-axis title 6 Categories