When you use a map in a dashboard, you can use custom point or region information from
Mapbox in a map. You can use an extra layer on a map to display additional information. For example,
a time-zone layer.
Before you begin
To use the vector maps from Mapbox as location measures in your map visualization, use a data
source that contains region or point data. An example of a table with point or region data is the
following table:
Table 1. Table with
point and region data
| City |
Population |
Timezone |
Timezone offset |
TZ |
| Andorra la Vella |
20430 |
Europe/Andorra |
1 |
UTC+01:00 |
| Abu Dhabi |
603492 |
Asia/Dubai |
4 |
UTC+04:00 |
The tileset that Mapbox generates has the following properties:
- Custom Tileset Id
- Custom layer name
- Custom property name
Procedure
- Create a Mapbox account.
- Upload your geoJSON file to Mapbox.
Important: Before you upload any geoJSON file, ensure that its polygon properties do not
contain any sensitive information.
-
In Mapbox, create a tileset based on the geoJSON file.
- In IBM®
Cognos® Analytics click
New and then click Dashboard.
-
Leave the default values in the Select a template window and click
OK.
-
In the left pane, click the Visualizations icon
 , and then click the Map icon.
- In the left pane, click Sources, and then click Add a
Source. Select a data source that contains that contains region or point
data.
-
In the visualization, expand and select
- Regions, if you want to use region data from Mapbox.
- Points, if you want to use point data from Mapbox.
-
In the left pane, expand your data items and drag either point or region data to the
Location data slot.
Note: Make sure you use the correct casing for the Mapbox properties.
Depending on
whether you want to use Mapbox region or point data, specify the following properties. These
properties are part of the Mapbox map. You must obtain the values of the properties from the Mapbox
map creator.
From the Properties pane under REGIONS, specify
the following properties:
| Option |
Description |
|---|
| Region custom Tileset Id |
The Mapbox unique Tileset Id. |
| Region custom layer name |
The layer name that is used in the Mapbox map. |
| Region custom property name |
The custom property name that you want to use from the Map box map. |
From the Properties pane under
POINTS, specify the following properties:
| Option |
Description |
|---|
| Point custom Tileset Id |
The Mapbox unique Tileset Id. |
| Point custom layer name |
The layer name that is used in the Mapbox map. |
| Point custom property name |
The custom property name that you want to use from the Map box map. |
-
Drag measurable data to the Location color data slot.
For
example, use population.
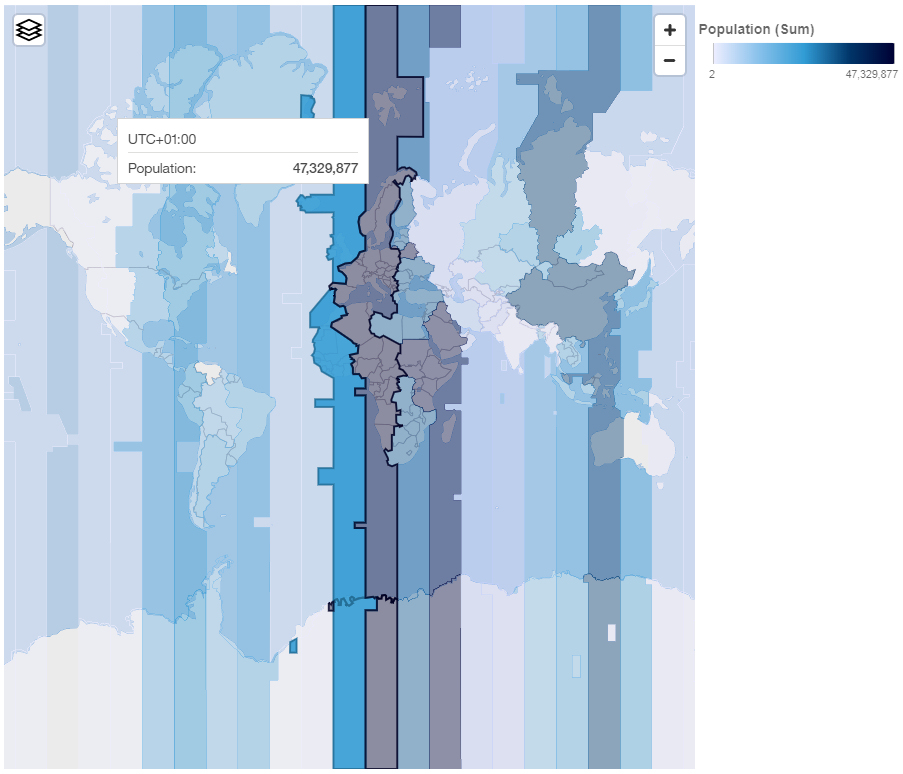
Example
An example of a map visualization with a region layer that shows the population for each
time-zone. The layout of the time-zones is defined in a Mapbox map.