Forecasting features
Forecasting provides time series data modeling and forecasts based on data in visualizations.
To use forecasting, the visualization must be either a line, bar, or column visualization, the
data must be supported for forecasting, and forecasting must be enabled. When forecasting is
enabled, a Forecast dialog box  is available in the upper right
corner of a visualization, where you can modify model and forecast settings, and confidence bounds.
Appropriate time series models for the visualization are estimated, and forecasts are displayed in
the visualization. You can also see the time series model specification and data processing summary
in the data tray.
is available in the upper right
corner of a visualization, where you can modify model and forecast settings, and confidence bounds.
Appropriate time series models for the visualization are estimated, and forecasts are displayed in
the visualization. You can also see the time series model specification and data processing summary
in the data tray.
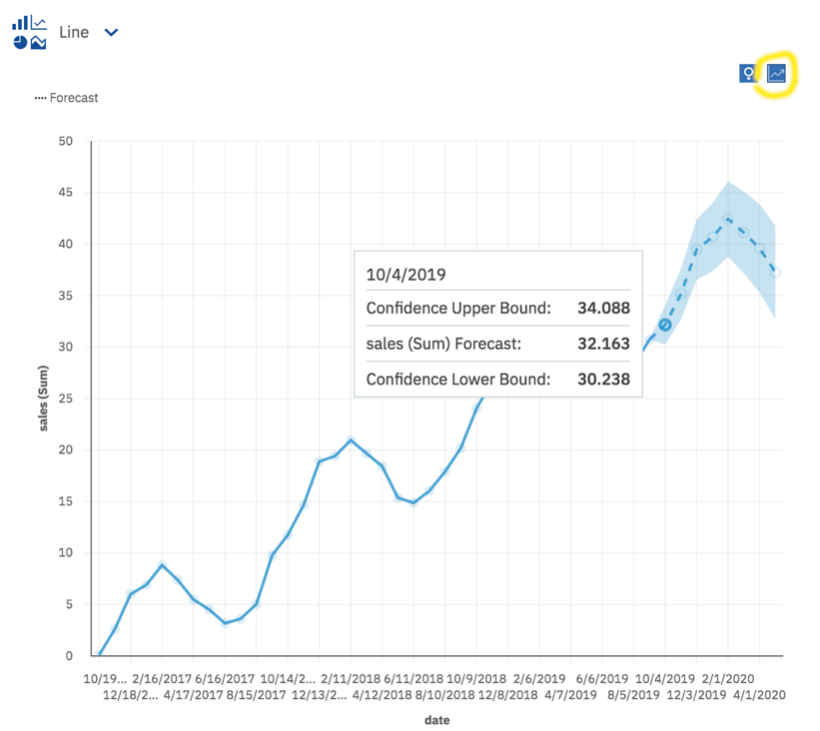
The following example shows forecasting values and confidence bounds in a visualization.