Storm events dashboard sample
This sample dashboard showcases the new mapping functionality in the context of storm event data.
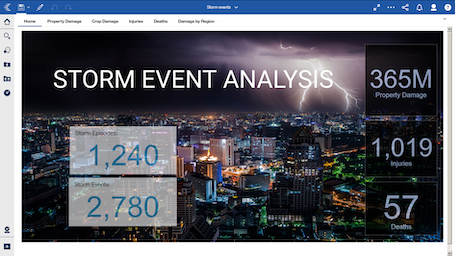
Key features of this sample include: custom polygons, custom regions, images, summary widgets , list visualizations, data player, maps with regions, points, text widgets, shape, word cloud visualizations, pie visualizations, donut radius, map ID, layer names, property names , show titles, and tabs.
 -
-
 This
sample is located here: Team content > Samples > Dashboards > Storm events.
This
sample is located here: Team content > Samples > Dashboards > Storm events.
 This
sample is located here: Team content > Samples > By feature > Core > Dashboards > Storm
events.
This
sample is located here: Team content > Samples > By feature > Core > Dashboards > Storm
events.