Legends
The legend of a visualization can be used to show the user how various channels like color and size are used to represent data.
For example, a grouped bar visualization might want to show the group labels on the x-axis while it shows the colors and data labels of the individual group elements in a legend. Another example is a bubble visualization, where a legend can be used to show the size-range or color-range of the bubbles.
Legends are rendered outside your custom visualization. For a legend to render the correct information, the visualization needs to provide a data structure that tells the legend what it shows. This data structure is generated automatically depending on the channel information that is found in the slots of the Visualization definition.
Categorical legends
A categorical legend shows a list of swatches that each represent a tuple from your data set. Each swatch can have a colored shape and has a caption. The list of swatches is based on the list of tuples on the slot that is represented by the legend.

The legend can also have a title, as shown in the season example. The title if often derived from the data item that the legend represents.
Continuous legends
A continuous legend shows the range of a value. The range can be expressed as a size range or a
color range. The channel property of a slot is used to distinguish between the
two.
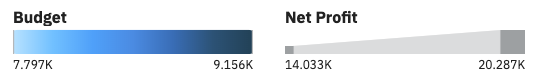
The images above shows a color legend and a size legend. The title of these legends is, like the categorical legend, which is derived from the data item that the legend represents.
Enabling legends
In general the only thing, you need to do as a bundle developer is provide the Visualization definition of your visualization. The Vizdef.xml file needs a few entries that allow RenderBase to determine if and how a legend should be created. If your Visualization definition has the required entries, then RenderBase creates the right data structures and passes them to the host application.
Legends are tied to the slot entries in your Visualization definition. Each
slot in the vizdef has an optional attribute called channel. The channel determines
the encoding type of a legend and can have the values color and size. The color type can be used for
both categorical (colored swatches) and continuous legends (color range). The size type is used for
continuous legends only (size range). If a slot has one of the known channel types, a legend for
that slot is rendered.
<slot name="series" type="cat" channel="color" />
<slot name="values" type="cont" channel="size,color" />
For slots with the color channel, you define a palette property. This allows the host application to assign a custom color scheme to the visualization and legend items. If no palette is available for the slot, then no legend is rendered for that slot.
type
attribute. If the palette is linked to a slot, the palette type is determined by the type of linked
slot.<slots>
<slot name="categories" type="cat" />
<!-- Series tuples will appear as color swatches in legend -->
<slot name="series" type="cat" channel="color" />
<!-- Values will appear both as size and color range in legend -->
<slot name="values" type="cont" channel="size,color" />
</slots>
<properties>
<!-- Categorical palette linked to 'series' slot -->
<palette name="series_colors" slot="series" />
<!-- Continuous palette linked to 'values' slot -->
<palette name="values_colors" slot="values" />
</properties>Modifying legends
In some specific situations, you want to change the information that is rendered in a legend. For
example, you might decide that based on a certain condition a legend might be visible or invisible.
RenderBase has a method that is called updateLegend that can be overridden to
provide such behavior. You can either modify the automatically created legend, or provide a new
one.
protected updateLegend( _data: DataSet ) : Encoding[]
{
    // Only show legend for 'heat' or 'categories', not both.
    const filterSlot = _data.cols[ HEAT ].mapped ? "heat" : "categories";

    // Only show a legend that matches `filterSlot`.
    return super.updateLegend( _data ).filter( _e => _e.slot === filterSlot );
}
The following example shows how to have the items in a categorical legend in reverse order and the legend title in uppercase:
public updateLegend( _data: DataSet ) : Encoding[]
{
    // Create default legend information.
    const legend = super.updateLegend( _data );

    // If legend is categorical, make caption upper case and reverse items.
    legend.forEach( _e =>
    {
        if ( _e instanceof CatEncoding )
        {
            _e.caption = _e.caption.toUpperCase();
            _e.entries.reverse();
        }
    } );
    return legend;
}
The API for creating and modifying legend needs the following import:
import { Encoding, CatEncoding, ContEncoding } from "@businessanalytics/customvis-lib";