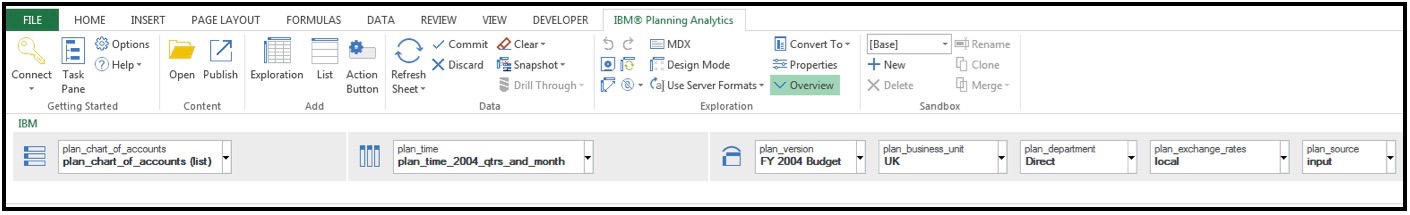
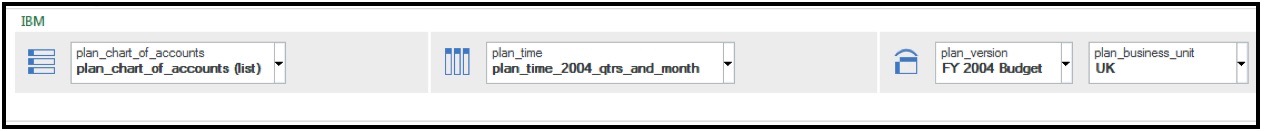
Exploration Views and lists
Use Exploration Views and lists to quickly change how you view performance measures and to show detailed information from your database in rows and columns.
Before you can create an Exploration View or list, the administrator must create a TM1® data source and publish it to a location to which you have access. The administrator must also configure your access privileges.
Administrators can create data sources and assign access privileges in IBM Cognos TM1 Performance Modeler or IBM Cognos TM1 Architect.
![]() Redo - Use the Redo tool to redo your last action.
Redo - Use the Redo tool to redo your last action.
![]() Save View - Use the Save View tool to save an Exploration View or list.
Save View - Use the Save View tool to save an Exploration View or list.
![]() Reset - Use the Reset tool to reset an Exploration View or list. This action will clear your
Exploration View or list.
Reset - Use the Reset tool to reset an Exploration View or list. This action will clear your
Exploration View or list.
![]() Swap Rows and Columns - Use the Swap Rows and Columns
tool to swap the rows and columns of an Exploration View for a different view of your data. To learn
more, see Swap rows and columns.
Swap Rows and Columns - Use the Swap Rows and Columns
tool to swap the rows and columns of an Exploration View for a different view of your data. To learn
more, see Swap rows and columns.
![]() Suppression Type - Use the Suppression Type tool to
suppress/hide zeros in the rows, columns, rows and columns, or apply no suppression at all.
Suppression Type - Use the Suppression Type tool to
suppress/hide zeros in the rows, columns, rows and columns, or apply no suppression at all.
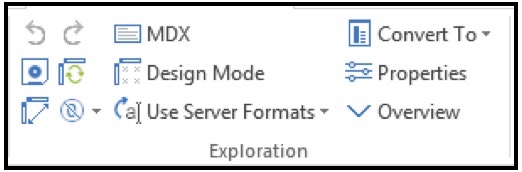
![]() MDX - Use the MDX tool to view or edit the MDX of the
report.
MDX - Use the MDX tool to view or edit the MDX of the
report.
![]() Use Server Formats - Use the Use Server Formats tool
to use server formats when you refresh an Exploration View or list. This tool will remove custom
formatting on refresh.
Use Server Formats - Use the Use Server Formats tool
to use server formats when you refresh an Exploration View or list. This tool will remove custom
formatting on refresh.
![]() Convert To - Use the Convert To tool to convert an
Exploration View to a Quick Report, Dynamic Report, or Custom Report. To learn more, see Converting a report.
Convert To - Use the Convert To tool to convert an
Exploration View to a Quick Report, Dynamic Report, or Custom Report. To learn more, see Converting a report.
![]() Properties - Use the Properties tool to set properties
for an Exploration View or a list that are specific
to a worksheet. To learn more, see Set properties.
Properties - Use the Properties tool to set properties
for an Exploration View or a list that are specific
to a worksheet. To learn more, see Set properties.
![]() Overview - Use the Overview tool to show or hide the
Overview bar.
Overview - Use the Overview tool to show or hide the
Overview bar.