Visualization tools
Big SQL integrates with easy-to-use tools for data visualization: Zeppelin notebooks, Data Science Experience, Tableau, and Cognos.
Apache Zeppelin notebooks
Developers can use Apache Zeppelin notebooks to interactively run data-intensive applications using Apache Spark on the Hadoop cluster.
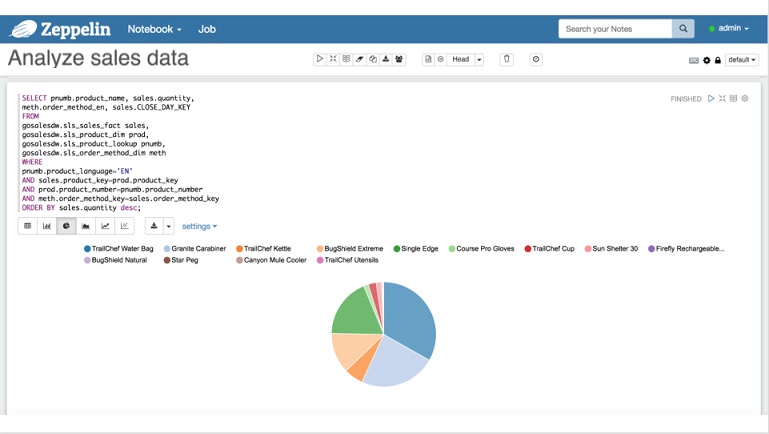
Learn more: Apache Zeppelin notebooks
Data Science Experience
You can configure Big SQL as a data source in Data Science Experience Local and then use DSX tools to analyze and visualize your data.
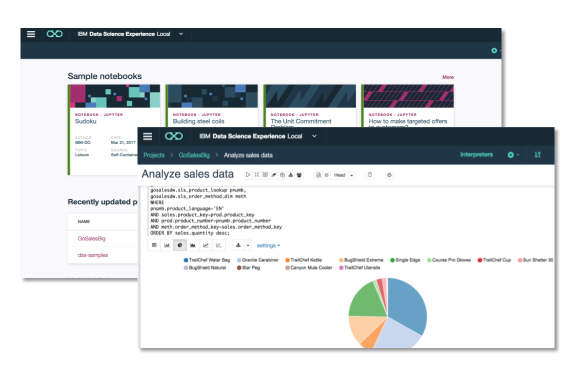
Learn more: Integrating with IBM Watson Studio Local
Tableau
Tableau provides a number of relational databases and Hadoop connectors to empower you to quickly and easily analyze rapidly growing data volumes. Tableau connectors integrate with Hadoop via the Hive layer, or using a SQL-on Hadoop technology, and with relational databases using native connectors or ODBC.
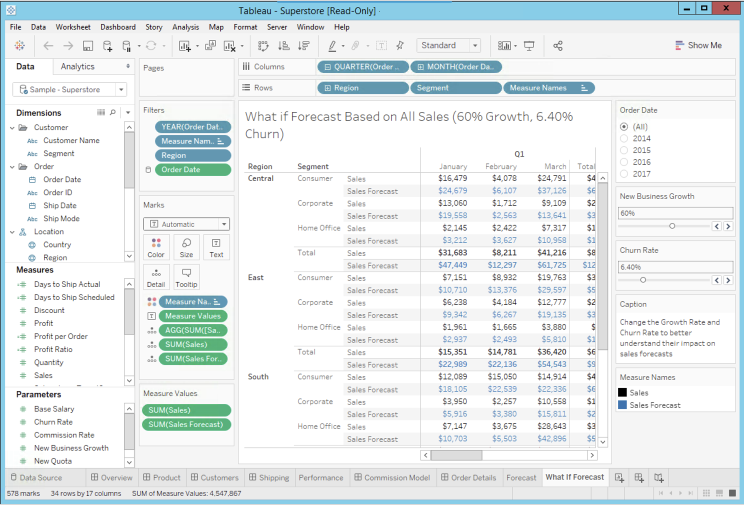
Learn more: Integrating with Tableau
Cognos
You can use IBM Cognos Analytics software to perform querying and reporting, analysis, scorecarding, and dashboarding on your BI data, allowing you to do the planning, scenario modeling, real-time monitoring, and predictive analytics needed for mission-critical business decisions.
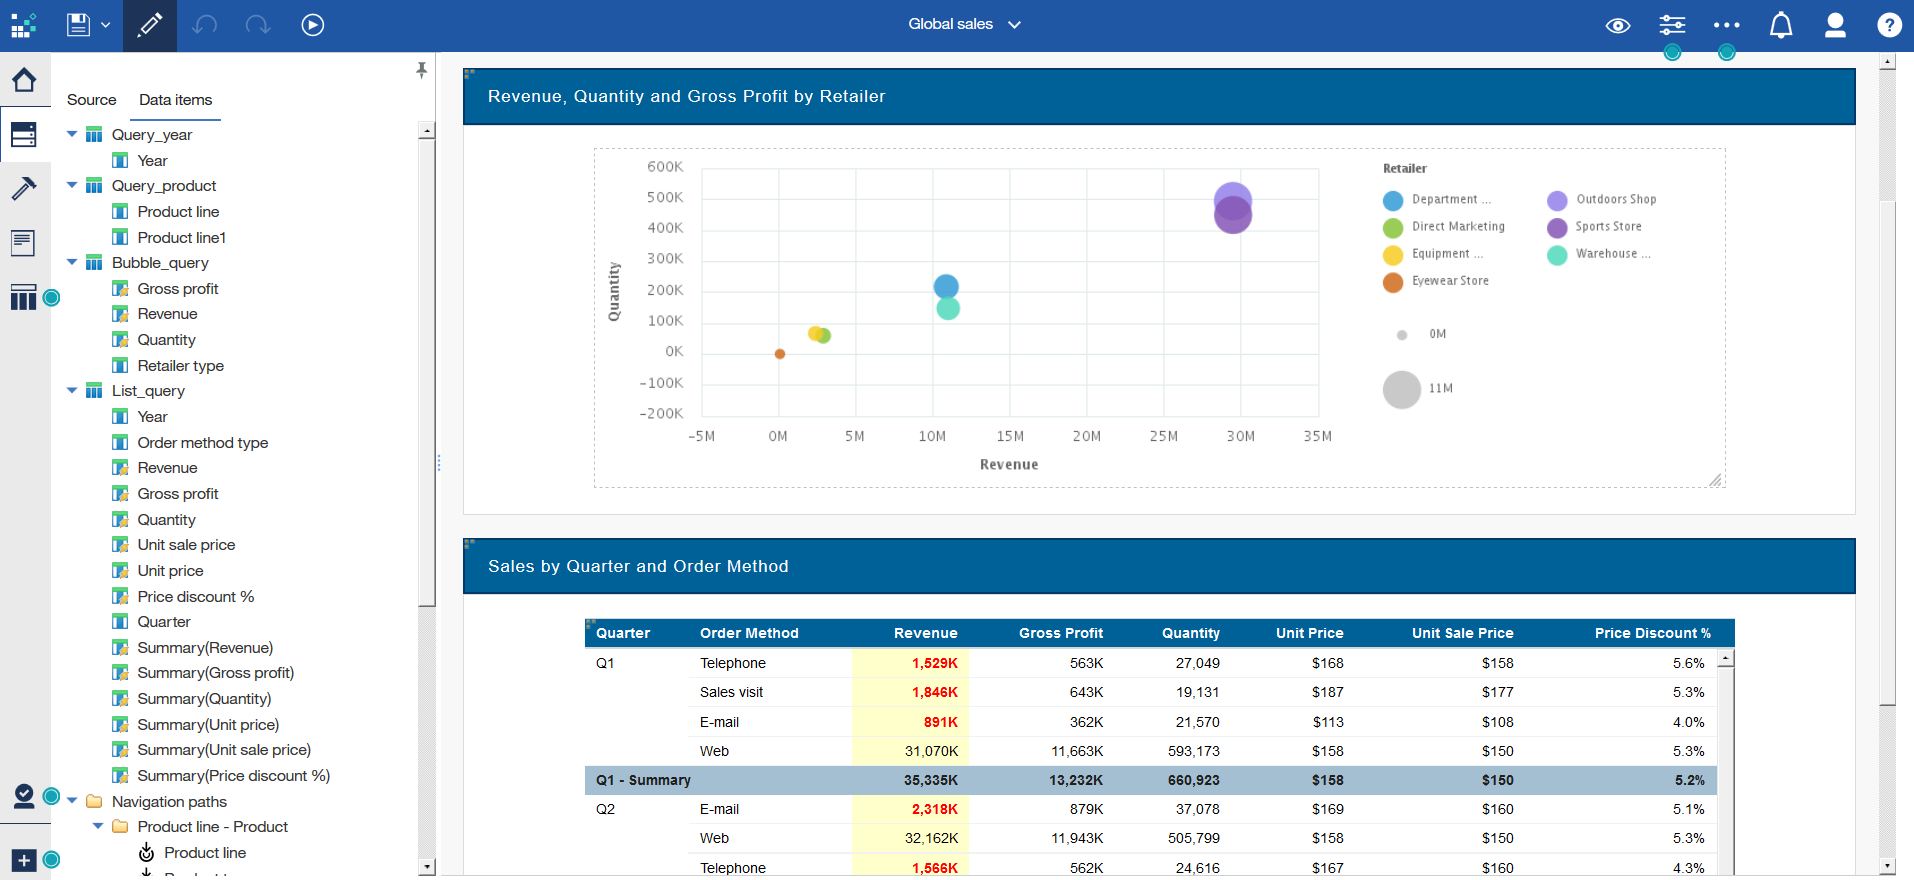
Learn more: Integrating with Cognos Analytics