RSE daemon
- procname
- The name of the member in a procedure library that was
used to start the server. The default name used during the host system
configuration is
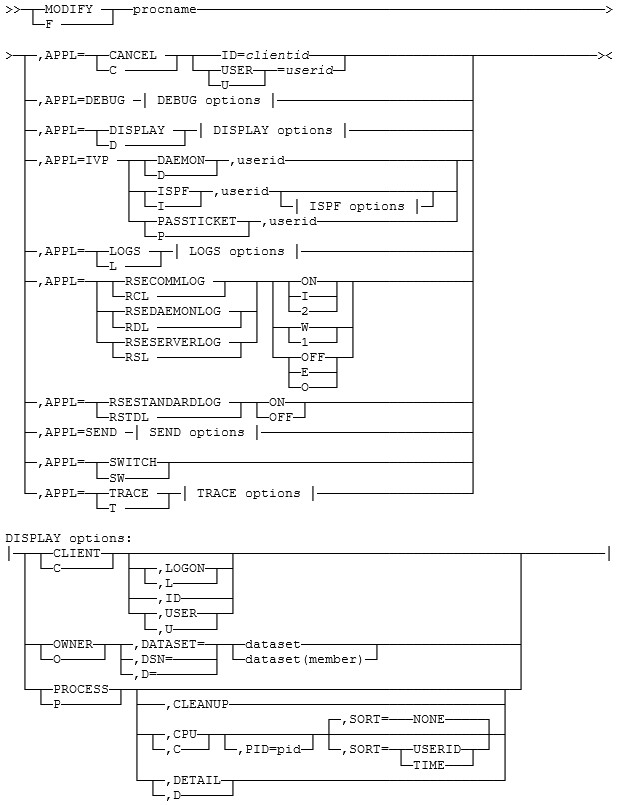
RSED. - DISPLAY CLIENT[{,LOGON | ,ID | ,USER}]
- Display the active clients in a single BPXM023I message. The result
layout depends on the command option that was used. You can change
the sorting order with the optional command arguments.
- No command option: Clients are grouped by the thread pool process
that serves them.
ProcessId(<processid>) ASId(<asid>) JobName(<jobname>) Clients(<local>/<total>) Order(<startup order>) <clientid><userid><connected since> - LOGON command option: Clients are ordered by logon time.
LOGON TIME------------------ ID----- USERID-- <connected since> <clientid> <userid> - ID command option: Clients are ordered by client ID. Each
session has a unique client ID, even if the related user ID is the
same.
ID----- USERID-- LOGON TIME------------------ <clientid> <userid> <connected since> - USER command option: Clients are ordered by user ID.
USERID-- ID----- LOGON TIME------------------
<userid> <clientid> <connected since>
- No command option: Clients are grouped by the thread pool process
that serves them.
- DISPLAY OWNER,DATASET={dataset | dataset(member)}
- Display the data set enqueue owner in a single BPXM023I message.
FEK217I <dataset[(member)]> is locked by <userid> FEK218I <dataset[(member)]> is not locked FEK219E Failed to determine lock owner for <dataset[(member)]>- The server also reports the locks held by other products, such as ISPF.
- The D GRS,RES=(*,dataset) operator command is unable to tell which z/OS® Explorer user is the actual enqueue holder, all it can tell you is the threadpool in which the user is active.
- DISPLAY PROCESS[{,CLEANUP | ,CPU [,PID=pid] [,SORT={NONE | TIME | USERID}] | ,DETAIL}]
- Display the RSE thread pool processes in one or more BPXM023I messages. There can be
multiple processes, which are used for load balancing the connected users.
ProcessId(<processid>) Memory Usage(<java heap usage>%) Clients(<number of clients>) Order(<startup order>) <error status>Note:<processid>can be used in process-specific z/OS UNIX operator commands.- Each process has its own Java™ heap, whose size
can be set in
rse.env. The reported Java heap usage includes storage that is released by z/OS Explorer, but which is not yet freed by the Java garbage collection process. <startup order>is a sequential number that indicates the order that the thread pools were started. The number corresponds to the number used in the filename of thestderr.*.logandstdout.*.logfiles.
In normal situations,<error status>is blank. Table 1 documents the possible non-blank values for<error status>.Table 1. Thread pool error status. This table lists the thread pool error status and their descriptions. Status Description *severe error* The thread pool process encountered an unrecoverable error and halted operations. The other status fields show the last known values. To remove this entry from the table, use the CLEANUP option of the DISPLAY PROCESS modify command. *killed process* The thread pool process was killed by Java, z/OS UNIX or an operator command. The other status fields show the last known values. To remove this entry from the table, use the CLEANUP option of the DISPLAY PROCESS modify command. *timeout* The thread pool process did not respond in a timely manner to RSE daemon during a client connect request. The other status fields show the current values. The thread pool is excluded for future client connect requests. The *timeout* status is reset when a client served by this thread pool logs off. *rejectLogon* The thread pool temporarily will not accept logon requests due to a heavy workload. Note that the logon request will be honored by another thread pool. Once the resource intensive task - for example, uploading a large file to a client - has completed, the *rejectLogon* status is reset. More information is provided when the DETAIL option of the DISPLAY PROCESS modify command is used:
ProcessId(33555087) ASId(002E) JobName(RSED8) Order(1)
 PROCESS LIMITS:    CURRENT  HIGHWATER      LIMIT
  JAVA HEAP USAGE(%)     10         56        100
  CLIENTS                 0         25         30
  MAXFILEPROC            83        103      64000
  MAXPROCUSER            97         99        200
  MAXTHREADS              9         14       1500
  MAXTHREADTASKS          9         14       1500
 REGION LIMITS:     CURRENT  HIGHWATER      LIMIT
  PRIVATE < 16M       72.0K          -       6.7M (6.9M)
  PRIVATE > 16M      610.8M          -    1731.0M (1811.0M)
  PRIVATE > 2G         2.0M       2.0M    NOLIMIT
The ASId field is the address space ID, in hexadecimal notation. The process limits table shows the current resource usage, the high-water mark for the resource usage, and the resource limit. Due to other limiting factors, the defined limit might never be reached. The region limits table shows the current private storage usage below the 16MB line, between the 16 MB line and the 2GB bar, and above the 2GB bar. The limits column shows a calculated limited, with the absolute number mentioned in braces. If storage usage is capped, then this will also be mentioned.
The CPU option of the DISPLAY PROCESS modify command shows the accumulated CPU usage, in milliseconds, of each thread in a thread pool. Every thread pool has a BPXM023I message. By default, all thread pools report the CPU usage, but you can limit the scope to a single thread pool by specifyingPID=pidon the operator command, wherepidis the process ID of the target thread pool. To sort the threads of each thread pool, specifySORT=fieldon the operator command. To sort alphabetically by user ID, replacefieldwithUSERID. To sort descending by accumulated CPU time, replacefieldwithTIME.ProcessId(421 ) ASId(007D) JobName(RSED8) Order(1) USERID THREAD-ID TCB@ ACC_TIME TAG STCRSE 0EDE540000000000 005E6B60 822 1/ThreadPoolProcess STCRSE 0EDE870000000001 005E69C8 001 STCRSE 0EDE980000000002 005E6518 1814 STCRSE 0EDEBA0000000003 005E66B0 2305 STCRSE 0EDECB0000000004 005E62F8 001 STCRSE 0EDEDC0000000005 005E60D8 001 STCRSE 0EDF860000000006 005C2BF8 628 6/ThreadPoolMonitor$Memory UsageMonitor STCRSE 0EDF970000000007 005C2D90 003 7/ThreadPoolMonitor STCRSE 0EDFDB0000000008 005C29D8 001 STCRSE 0EE22E000000000E 005C1BE0 070 IBMUSER 0EE0EB0000000011 005C22B8 276 20/ServerReceiver IBMUSER 0EE2500000000012 005C19C0 137 16/ServerUpdateHandler IBMUSER 0EE2610000000013 005C17A0 509 15/ServerCommandHandler IBMUSER 0EE1840000000014 005C1E00 065 21/ZosSystemMiner STCRSE 0EE1510000000016 005C2098 078 STCRSE 0EE1950000000017 005C1580 001 IBMUSER 0EE23F0000000018 005C1360 021 26/UniversalFileSystemMine r IBMUSER 0EE2A5000000001C 005C0CF0 003 27/EnvironmentMiner IBMUSER 0EE283000000001D 005C1140 002 31/CommandMiner IBMUSER 0EE272000000001E 005C0E88 081 32/MVSFileSystemMiner IBMUSER 0EE294000000001F 005C0AD0 002 33/MVSByteStreamHandler$Op enCloseThread STCRSE 0EE2E90000000023 005C0470 001 IBMUSER 0EE2C70000000024 005C08B0 050 38/JESMinerIf the output size exceeds the maximum number of lines for a console message, the output is split over multiple BPXM023I messages. These additional messages have the same header as the first message, but with theCONTINUATIONkeyword added to the first line.ProcessId(421 ) ASId(007D) JobName(RSED8) Order(1) CONTINUATION USERID THREAD-ID TCB@ ACC_TIME TAGThe output is limited to the first 4000 threads for each thread pool.
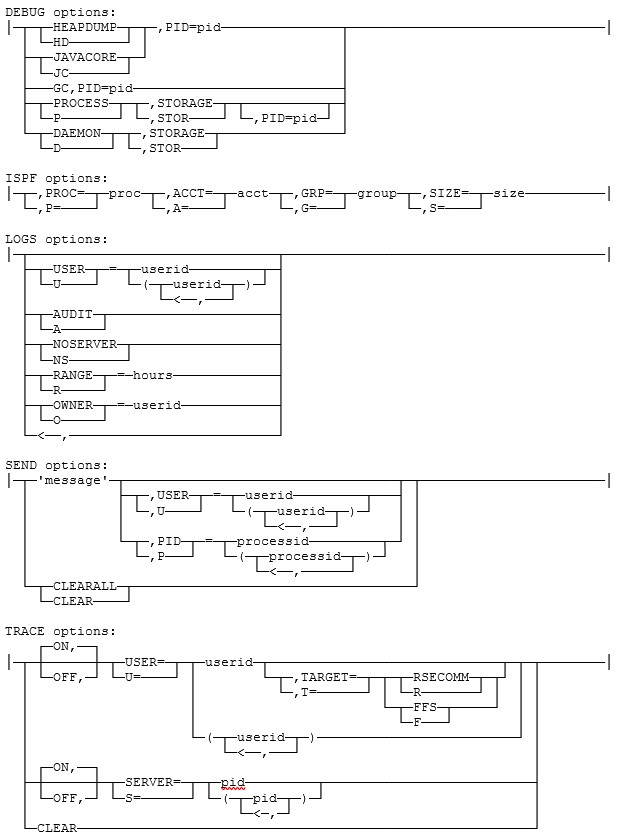
- SEND 'message'[,USER={userid | (userid,userid,…)}]
- Send a message to one, some, or all z/OS Explorer users. By default the message is sent to all users. Users that are currently active receive the message immediately, others receive it on the next logon.
- SEND 'message'[,PID={processid | (processid,processid,…)}]
- Send a message to all users in one, some, or all thread pools. By default the message is sent to all thread pools. Thread pools are identified by their process ID.
- SEND CLEARALL
- Clear the buffer holding all messages to be delivered to users logging on.
- CANCEL ID=clientid
- Cancel a client connection based on the client ID, which is shown
in the DISPLAY CLIENT modify command. Each
session has a unique client ID, even if the related user ID is the
same.
When a client connection is cancelled, the host system threads go through normal termination processing to clean up resources used by them. This action implies that some threads can take a few minutes before they end; for example, because they are waiting on the keep-alive mechanism to time out.
- CANCEL USER=userid
- Cancel a client connection based on the client's user ID, which
is shown in the DISPLAY CLIENT modify command.
When a client connection is cancelled, the host system threads go through normal termination processing to clean up resources used by them. This action implies that some threads can take a few minutes before they end; for example, because they are waiting on the keep-alive mechanism to time out.
- LOGS [USER={userid | (userid,userid,…)},] [AUDIT,][NOSERVER,][RANGE=hours,][OWNER=userid,]
- Collect z/OS Explorer host
logs and setup information. The collected data is placed in a z/OS UNIX file,
$TMPDIR/feklogs%sysname.%jobname, where$TMPDIRis the value of the TMPDIR directive inrse.env(default/tmp),%sysnameis your z/OS system name and%jobnameis the name of the RSED started task. Results are shown in a single FEK201I console message.By default, only the server logs are collected. The following command options allow you to collect different logs.FEK220I Host logs are written onto /tmp/feklogs.CDFMVS08.RSED.logTable 2. Command options. This table lists the options of the command that collects host logs and setup information. Option Description USER Collect log files for the specified user ID's AUDIT Collect audit logs NOSERVER Do not collect server logs By default, all available log files are collected. The RANGE command option allows you to limit this selection to those log files that were updated in the last given number of hours.
z/OS Explorer will query your security product for access permits to
FEK.CMD.LOGS.**profiles to determine if the requestor is allowed to collect the specified logs. By default, the requestor is the RSED started task user ID, unless theOWNERoption is specified. Only the requestor has access to the file holding the collected data. - RSECOMMLOG {ON | OFF | I | W | E | 2 | 1 | 0}
- Control the trace detail level for RSE server (
rsecomm.log) and the MVS™ data set services (lock.logandffs*.log). The startup default is defined inrsecomm.properties. The following detail levels are available.Table 3. Trace detail levels for RSE server ( rsecomm.log) and the MVS data set services (lock.logandffs*.log). This table lists the trace detail levels for RSE server (rsecomm.log) and the MVS data set services (lock.logandffs*.log).Detail level Description E or 0 or OFF Error messages only. W or 1 Error and warning messages. This is the default setting in rsecomm.properties.I or 2 or ON Error, warning, and informational messages. Detailed tracing will cause performance degradations and should only be done under the direction of the IBM® support center.
- RSEDAEMONLOG {ON | OFF | I | W | E | 2 | 1 | 0}
- Control the trace detail level for RSE daemon (
rsedaemon.log). The startup default is defined inrsecomm.properties. The following detail levels available.Table 4. Trace detail levels for RSE daemon ( rsedaemon.log). This table lists the trace detail levels for RSE daemon (rsedaemon.log).Detail level Description E or 0 or OFF Error messages only. W or 1 Error and warning messages. This is the default setting in rsecomm.properties.I or 2 or ON Error, warning, and informational messages. Detailed tracing will cause performance degradations and should only be done under the direction of the IBM support center.
- RSESERVERLOG {ON | OFF | I | W | E | 2 | 1 | 0}
- Control the trace detail level for RSE thread pools (
rseserver.log). The startup default is defined inrsecomm.properties. The following detail levels are available.Table 5. Trace detail levels for RSE thread pools ( rseserver.log). This table lists the trace detail levels for RSE thread pools (rseserver.log).Detail level Description E or 0 or OFF Error messages only. W or 1 Error and warning messages. This is the default setting in rsecomm.properties.I or 2 or ON Error, warning, and informational messages. Detailed tracing will cause performance degradations and should only be done under the direction of the IBM support center.
- RSESTANDARDLOG {ON | OFF}
- Disable (
OFF) or enable (ON) the updating of the log files that hold the stdout and stderr streams of thestdout.*.logandstderr.*.logthread pools. The startup default is defined by theenable.standard.logdirective inrse.env.Detailed tracing will cause performance degradations and should only be done under the direction of the IBM support center.
- TRACE [{ON, | OFF,}]USER=userid[,TARGET={FFS | RSECOMM}]
- Enable (
ON) or disable (OFF) tracing for the specified user IDs. The default isON. This setting overrules the default setting controlled by the MODIFY RSECOMMLOG operator command. The following detail levels are available.Table 6. Trace detail levels for the specified user IDs. This table lists the trace detail levels for the specified user IDs. Detail level Description OFF Error messages only ON (default) Error, warning, and informational messages. The command alters the trace detail level for RSE server (rsecomm.log) and the MVS data set services (lock.logandffs*.log). This can be limited with theTARGETkeyword, which accepts the following values.Table 7. Keyword values. This table lists the values of the TARGETkeyword of the command.Values Description FFS Set the specified log level only for MVS data set services ( lock.logandffs*.log)RSECOMM Set the specified log level only for RSE server ( rsecomm.log)The command can be issued for users that are currently not logged on. The setting remains active when a user logs off and will be used again when the user logs on.
Use the
USERdirective inrsecomm.propertiesto simulate issuing the MODIFY TRACE USER command at server startup. Existing settings from previous MODIFY TRACE USER or MODIFY TRACE SERVER operator commands or theUSERdirective inrsecomm.propertieswill be replaced by the setting of this command.Detailed tracing will cause performance degradations and should only be done under the direction of the IBM support center.
- TRACE [{ON, | OFF,}]USER=(userid,userid,…)
- Enable (
ON) or disable (OFF) tracing for the specified user IDs. The default isON. This setting overrules the default setting controlled by the MODIFY RSECOMMLOG operator command. The following detail levels are available.Table 8. Trace detail levels for the specified user IDs. This table lists the trace detail levels for the specified user IDs. Detail level Description OFF Error messages only. ON (default) Error, warning, and informational messages. The command alters the trace detail level for RSE server (
rsecomm.log) and the MVS data set services (lock.logandffs*.log). The command can be issued for users that are currently not logged on. The setting remains active when a user logs off and will be used again when the user logs on. Use theUSERdirective inrsecomm.propertiesto simulate issuing the MODIFY TRACE USER command at server startup. Existing settings from previous MODIFY TRACE USER or MODIFY TRACE SERVER operator commands or theUSERdirective inrsecomm.propertieswill be replaced by the setting of this command.Detailed tracing will cause performance degradations and should only be done under the direction of the IBM support center.
- TRACE [{ON, | OFF,}] SERVER={pid | (pid,pid,…)}
- Enable (
ON) or disable (OFF) tracing for all users in the specified thread pool wherepidis the process ID of an RSE thread pool. The default isON. This setting overrules the default setting controlled by the MODIFY RSECOMMLOG operator command. The following detail levels are available.Table 9. Trace detail levels for all users in the specified thread pool. This table lists the trace detail levels for all users in the specified thread pool. Detail level Description OFF Error messages only. ON (default) Error, warning, and informational messages. The command alters the trace detail level for RSE server (
rsecomm.log) and the MVS data set services (lock.logandffs*.log). Existing settings from previous MODIFY TRACE USER or MODIFY TRACE SERVER operator commands or theUSERdirective inrsecomm.propertieswill be replaced by the setting of this command.Detailed tracing will cause performance degradations and should only be done under the direction of the IBM support center.
- TRACE CLEAR
- Remove all trace overrides set by the MODIFY TRACE
USER and MODIFY TRACE SERVER operator
commands and the
USERdirective inrsecomm.properties. - DEBUG HEAPDUMP,PID=pid
- Request a Java Heap dump
for a specified thread pool, where
pidis the process ID of an RSE thread pool. The dump is written to the directory specified by_CEE_DUMPTARGinrse.env, where the default value is/tmp. Results are shown in a single BPXM023I console message.JVMDUMP034I User requested Heap dump using '/tmp/heapdump.20120223.211' 430.16777590.0001.phd' through JVMRI - DEBUG JAVACORE,PID=pid
- Request a Java Core dump
for a specified thread pool, where
pidis the process ID of an RSE thread pool. The dump is written to the directory specified by_CEE_DUMPTARGinrse.env, where the default value is/tmp. Results are shown in a single BPXM023I console message.JVMDUMP034I User requested Java dump using '/tmp/javacore.20120223.214 244.16777590.0002.phd' through JVMRI - DEBUG GC,PID=pid
- Request a Java Garbage Collection
for a specified thread pool, where
pidis the process ID of an RSE thread pool. - DEBUG DAEMON,STORAGE
- Request an overview of current real storage usage for RSE daemon. Results are shown in a BPXM023I message. See the description of DEBUG PROCESS,STORAGE for a sample output.
- DEBUG PROCESS,STORAGE [,PID=pid]
- Request an overview of current real storage usage for a thread
pool. Every thread pool has a BPXM023I message showing the results. By
default, all thread pools report the storage usage, but you can limit
the scope to a single thread pool by specifying PID=pid on the operator
command, where pid is the process ID of the target thread pool. The
storage usage report shows various storage-related fields with sizes
in bytes, kilobytes, and megabytes. If storage usage is capped, then this will
also be mentioned. A summarized version of this data is included in
the output of the DISPLAY PROCESS,DETAIL operator command.
ProcessId(484 ) ASId(00C9) JobName(RSED9 ) Order(2) below 16M line LDASIZA 7315456 7144.0K 6.9M maximum region size LDALIMIT 7315456 7144.0K 6.9M limit LDAVVRG 7315456 7144.0K 6.9M getmain limit LDALOAL 73728 72.0K 0.0M in use LDAHIAL 253952 248.0K 0.2M LSQA/SWA/private subpools _GAP 0 0.0K 0.0M gaps in allocation _AVAIL 6987776 6824.0K 6.6M available (including gaps) _MAX 7061504 6896.0K 6.7M current limit above 16M line LDAESIZA 1898971136 1854464.0K 1811.0M maximum region size LDAELIM 1898971136 1854464.0K 1811.0M limit LDAEVVRG 1898971136 1854464.0K 1811.0M getmain limit LDAELOAL 639860736 624864.0K 610.2M in use LDAEHIAL 83677184 81716.0K 79.8M ELSQA/ESWA/private subpools _EGAP 12288 12.0K 0.0M gaps in allocation _EAVAIL 1175433216 1147884.0K 1120.9M available (including gaps) _EMAX 1815293952 1772748.0K 1731.1M current limit above 2G bar RAXLVMEMLIM 17592186040320.0M NOLIMIT limit (REG=0) RAXLVABYTES 2.0M 2.0M allocated RAXLVHBYTES 0 0 guarded RAXLVGBYTES 2.0M 2.0M high water mark RAXLVNMOMB 2 # of objects - IVP DAEMON,userid
- Log user ID
useridon to RSE daemon to do a connection test. Results are shown with one or more FEK900I console messages. The return code is shown with console message FEK901I.Note:- When the test is successful, the function displays a success message.
- The function is similar to what the
fekfivpdIVP (Installation Verification Program) does. - RSE daemon generates a PassTicket which is used as password for the IVP, so there is no Write To Operator with Reply (WTOR) requesting a password.
- IVP ISPF,userid[,PROC=proc,Acct=acct,GRP=group,SIZE=size]
- Test Legacy ISPF Gateway or Interactive ISPF Gateway with user
ID userid. Interactive ISPF Gateway requires that you specify a TSO
logon procdure (proc), TSO account number (acct), security group (group)
and TSO region size (size). Results are shown with one or more FEK900I
console messages. The return code is shown with console message FEK901I.Note:
- When the test is successful, the function displays a success message.
- The function is similar to what the
fekfivpiIVP (Installation Verification Program) does. - RSE daemon generates a PassTicket which is used as password for the IVP, so there is no Write To Operator with Reply (WTOR) requesting a password.
- IVP PASSTICKET,userid
- Test the reusability of a PassTicket generated for user ID
userid. Results are shown with one or more FEK900I console messages. The return code is shown with console message FEK901I.Note:- When the test is successful, the function displays a success message.
- When using RACF® as security
product, reusable PassTickets require the “
NO REPLAY
PROTECTION
” keyword in the security definitions. - There is no equivalent IVP (Installation Verification Program) for this test.
- RSE daemon generates a PassTicket which is used as password for the IVP, so there is no Write To Operator with Reply (WTOR) requesting a password.
- SWITCH
- Switch to a new audit log file.