Configuring Web Response Time from the GUI (UNIX and Linux)
- Make sure that you understand and have collected the configuration parameters for this agent from Web Response Time parameters and that you have collected all the information in Information to collect before you begin installation and configuration. You use this information in completing these steps.
- Open a command prompt and navigate to the install_dir/bin directory.
Where install_dir is the installation location for the monitoring agent. The default installation location is /opt/IBM/ITM.
- Run the ./itmcmd manage command to display
the Manage Tivoli Enterprise Monitoring Services window.
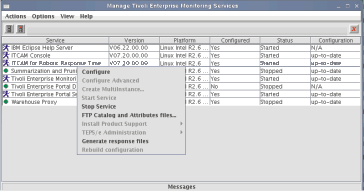
- Right-click the Web Response Time agent and select Configure to start the basic configuration.
- In the Web Response Time Basic
Configuration window, select the appropriate check boxes
as needed and enter additional information as requested. Note that
the input fields change depending on which options you select. The
option to monitor all HTTP transactions is selected by default.
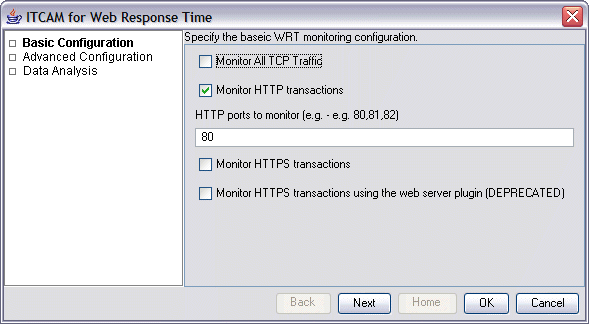
HTTP vs TCP monitoring: If you select Monitor All TCP Traffic, TCP traffic is monitored and response time and bandwidth related metrics for this traffic will be available in the Application, Client, and Server workspaces. Using HTTP monitoring, a web request is merged with its object requests (GIF, CSS, etc), compared to TCP monitoring, in which each of these requests is counted separately. Therefore, a single HTTP transaction can equate to many TCP transactions. So, depending on how you configure your Web Response Time agent, this information is displayed differently in the Web Response Time workspaces from the Network node in the TEP Navigator view. For more information about defining components in the Application Management Configuration Editor, see the Administrator's Guide.
Specify the following basic configuration information:- Optionally select Monitor All TCP Traffic to enable the agent to monitor TCP traffic.
- Optionally select Monitor HTTP transactions to enable the agent to monitor HTTP traffic (this is selected by default). In the HTTP Ports to Monitor field, specify one or more ports to monitor, separated by commas, with no blank spaces. The default is port 80.
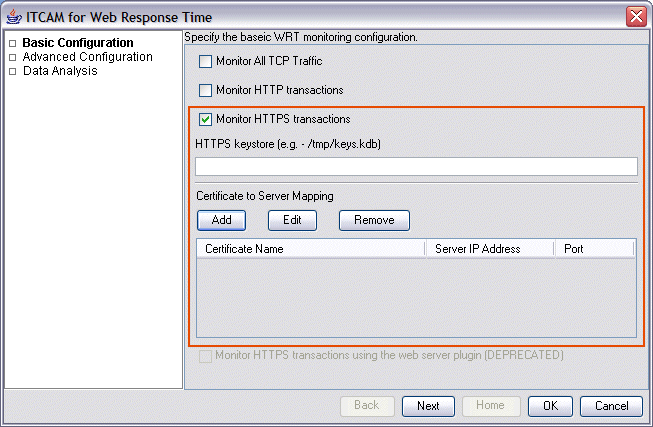
- Optionally select Monitor HTTPS transactions to
enable the agent to monitor HTTPS traffic. Optionally, specify the
following additional information:
- Specify the HTTPS keystore containing the remote certificates of the remote HTTPS web sites to be monitored.
- Specify the Certificate to Server Mapping, which defines which remote servers should be monitored, and the SSL certificate used by each remote server. Use the Add, Edit, and Remove buttons to define certificate names, server and port information.
- Click Next to continue to the Advanced Configuration window.
- In the Web Response Time Advanced
Configuration window, specify additional optional configuration
information as needed.
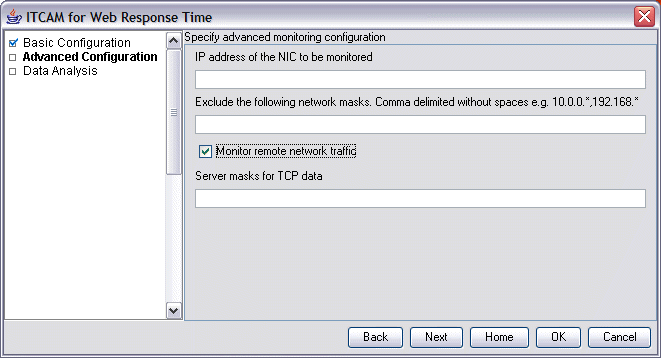
- The IP address of the selected NIC card to be monitored.
- One or more network masks to be excluded from monitoring, separated by commas, with no blank spaces. For example, you might enter 9.48.152.*,9.48.164.*, which prevents traffic on subnets 9.48.152 and 9.48.164 from being processed.
- Select the Monitor remote network traffic check box if you want to monitor all network traffic on the NIC. If you do not select this option, only the local traffic to and from the local IP address is monitored.
- One or more server masks for TCP data monitoring, separated by
commas, with no blank spaces (for example, 10.0.0.*,192.168.*).
TCP data coming from an IP address that matches one of these masks
is marked as coming from a server, and not a client group.
Use this field when you are using multiple Web Response Time agents to provide TCP tracking data to Transaction Reporter. In this scenario, to display TCP topology correctly, this data is displayed in the resulting topology view as coming from a server instead of a client. For example, suppose Web Response Time agent WRT1 observes traffic from clients to server 9.48.152.1, and another Web Response Time agent, WRT2, observes traffic from server 9.48.152.1 to server 9.48.152.2. In this case, WRT2 should be configured with a server mask that includes 9.48.152.1.
- Click Next to continue to the Data
Analysis window and specify additional configuration information
defining how the collected data is to be analyzed.
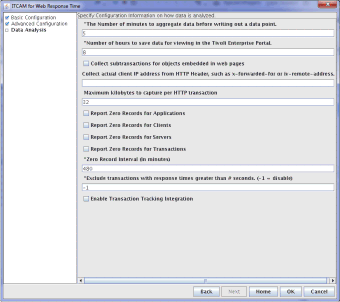 Accept the defaults, or optionally specify the following information:
- Specify the number of minutes to aggregate data before it is saved and summarized into an aggregate data point. The default is every 5 minutes. For example, to see data in larger aggregate intervals (for SLA reporting without diagnosis), change the default value from 5 minutes to a larger value, such as 15, 30, or 60 minutes.
- Specify the number of hours that data is saved for viewing in the TEP. The default of 8 hours
causes the TEP to display aggregate data collected during the last 8 hours.Note: Regardless of the period set, only the most recent occurrence of a transaction is displayed in the workspaces. Use historical workspaces to view all transactions for a period.
- Optionally select the check box to indicate that subtransactions should be collected for embedded objects (such as GIF) in web pages.
- Optionally, in the Collect actual client IP address from HTTP Header field, specify the header that you want to contain incoming client IP addresses. If you do not specify a header and are using a load balancer for example, all packets processed by Web Response Time have the IP address of the load balancer.
- Specify the maximum number of kilobytes in each HTTP request or reply. The default is 32 kilobytes.
- Optionally select the check boxes for reporting zero records for applications, clients, servers, or transactions for the duration of the zero record interval.
- Specify the number of minutes to continue to report zero records. The default is 480 minutes (8 hours).
- Optionally specify a response time threshold value in seconds, which causes any transactions with response times greater than the threshold value to be excluded from all calculations. The default value is -1, which disables this function and includes all transactions, regardless of their response time, in the calculations.
- Optionally select the Enable Transaction Tracking Integration check
box to cause the Web Response Time agent
to send its data to the Transaction Collector agent
using generated Transaction Tracking API events
for transaction tracking integration. Accept the additional default
values that are displayed, or specify your own values for the following
parameters:
- Transaction Tracking Thread Count (default is 5)
- Transaction Collector connection string
- A comma separated, case-sensitive string of cookie names to ignore during tracking.
Note: You cannot enable transaction tracking integration if HTTPS (plugin mode) is enabled. The Web Response Time agent cannot obtain the necessary tracking information from transactions monitored in HTTPS plugin mode.
- Click OK to display the TEMS Connection window.
- Specify the TEMS connection settings.
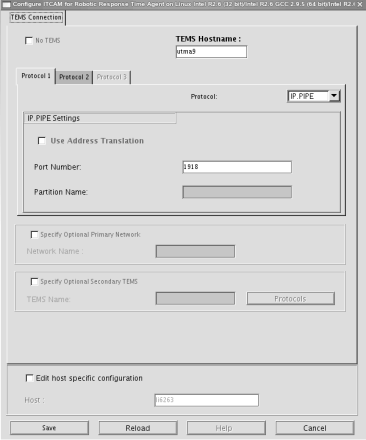
- Click Save.
- Close the Manage Tivoli® Enterprise Monitoring Services window.
- Restart the monitoring agent. See Starting and stopping servers and agents.
- Manually stop and then restart the web server.
Configuring Web Response Time on AIX systems
On AIX, the default Soft data limit is too small for the Web Response Time agent to operate effectively.
Modify the /etc/security/limits file to change the data segment size memory limit to unlimited (in the limits file, change the value of the data parameter to -1 to set it as an unlimited value).
On any operating system, if the value of data is too low, the agent might shut down unexpectedly if it needs more memory than has been allocated. For more information about configuring the data segment size value, see the following Redbooks publication: http://www.redbooks.ibm.com/abstracts/TIPS0154.html.