Collecting metrics for historical trends reports
Before you can build trends reports that show changes over time, you must configure and
schedule Lifecycle Query Engine tasks to
collect data.
About this task
You create, edit, and enable metric collection tasks on the Data metrics
administration page at
http://<host_name>:<port>/lqe/web/admin/metric-config.
A sample task is available on the Data metrics page. To modify this task,
click the task name, and change the settings:
- You can change the task name.
- You can edit the schedule to collect metrics at a different time.
- Choose the configurations that contain the versions of the artifacts you want historical metrics on.
- Select what metrics to gather.
To run this task, click Run now.
To create a data collection task, follow the procedure.
Procedure
-
Go to the Data metrics page at
http://<host_name>:<port>/lqe/web/admin/metric-config. On the Lifecycle Query Engine Administration page, find Data metrics in the menu, under Query & report data.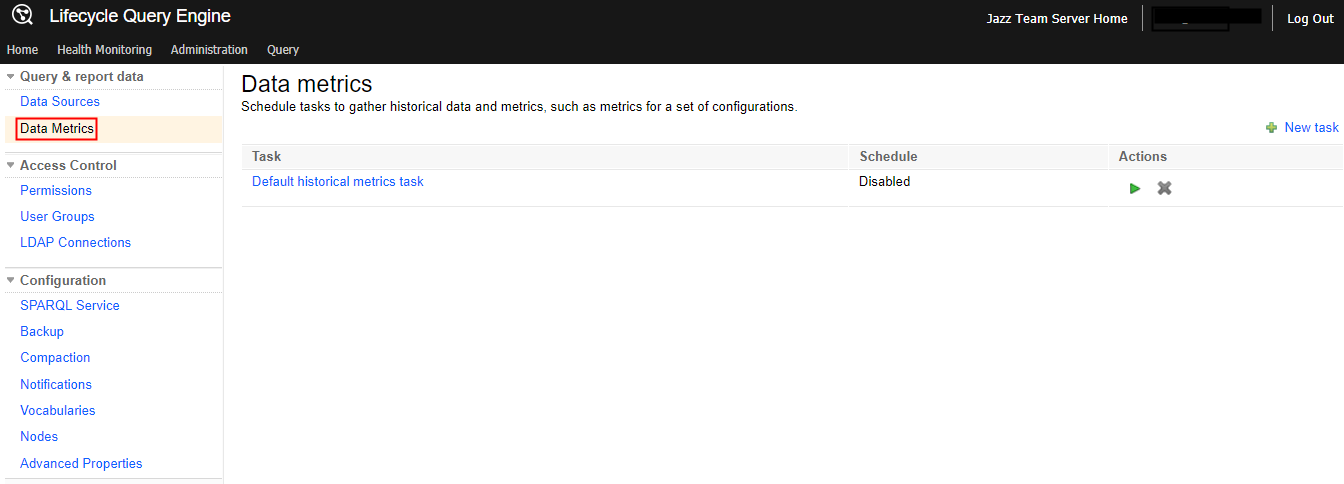
-
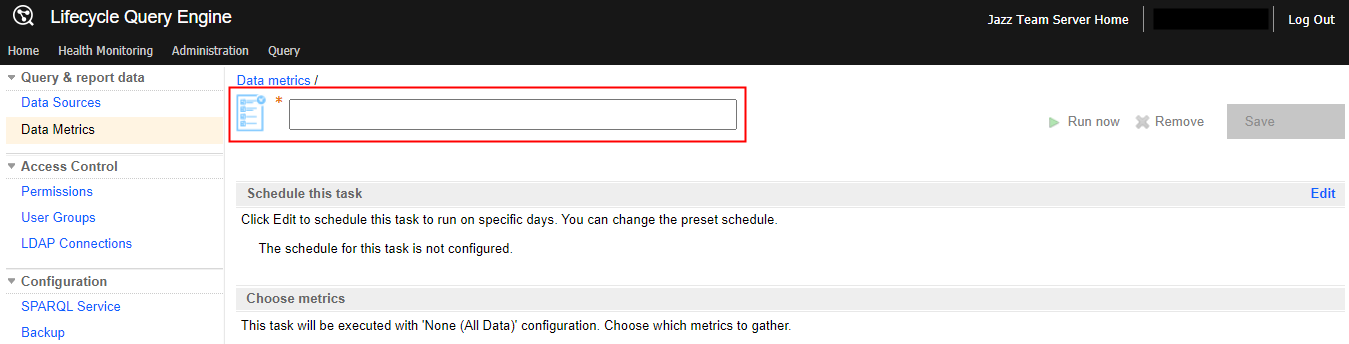
Click New task, and enter the task name.
-
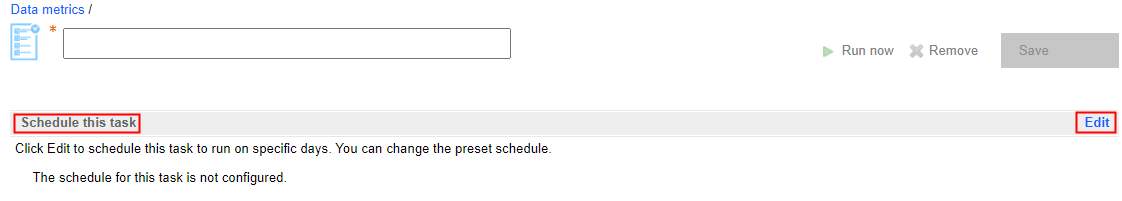
Schedule the task.
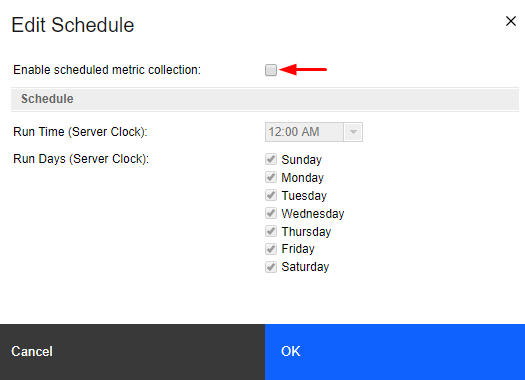
Click Edit to enable the task, and configure the date and time.Important: Collecting data can be resource-intensive. Schedule the task to run when the server isn’t heavily used.
- Select the check box to enable the task.
- Select the days and time. Then, click OK to save.
-
Add the configurations that contain the versions of the artifacts you want to collect metrics
on.
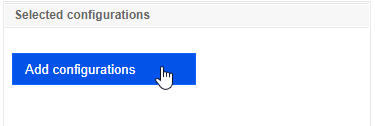
- Click Add configurations to add a new
configuration. If you don't add any configuration, the task collects metrics from all data.Important: To avoid performance issues, choose only the configurations you want to focus on. If you collect historical metrics from all the data, you end up running resource-intensive data collection jobs for each configuration.
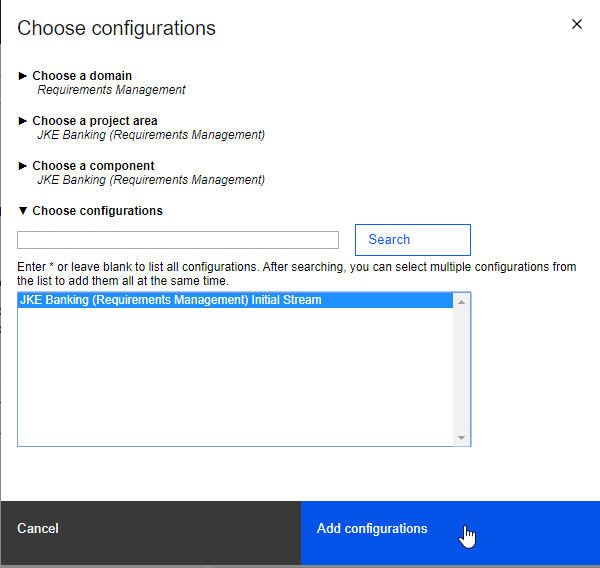
- Select the required domain, project area, component, and configurations. Then, click
Add configurations.
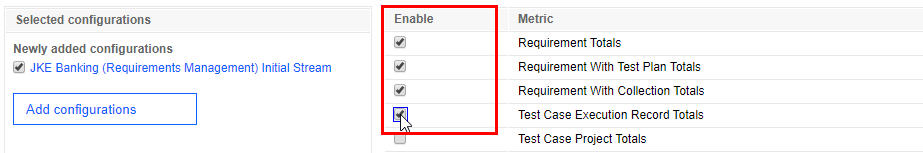
Remember: Metric collection isn’t automatically enabled for new configurations; you must add new configurations to existing tasks.You can see new configuration added in the Selected configurations section as Newly added configurations. - Click Add configurations to add a new
configuration.
-
Choose what metrics to gather by selecting the Enable check box.
What to do next
If team members choose an LQE-based data source and the Report Builder reports don’t show the artifacts that they expect, show artifacts more than once, or show a different number of artifacts than application views, you can validate the TRS feeds for the application. See Validating TRS feeds and the LQE index.