CPU: MIPS Used - LPAR Level by WLM Importance
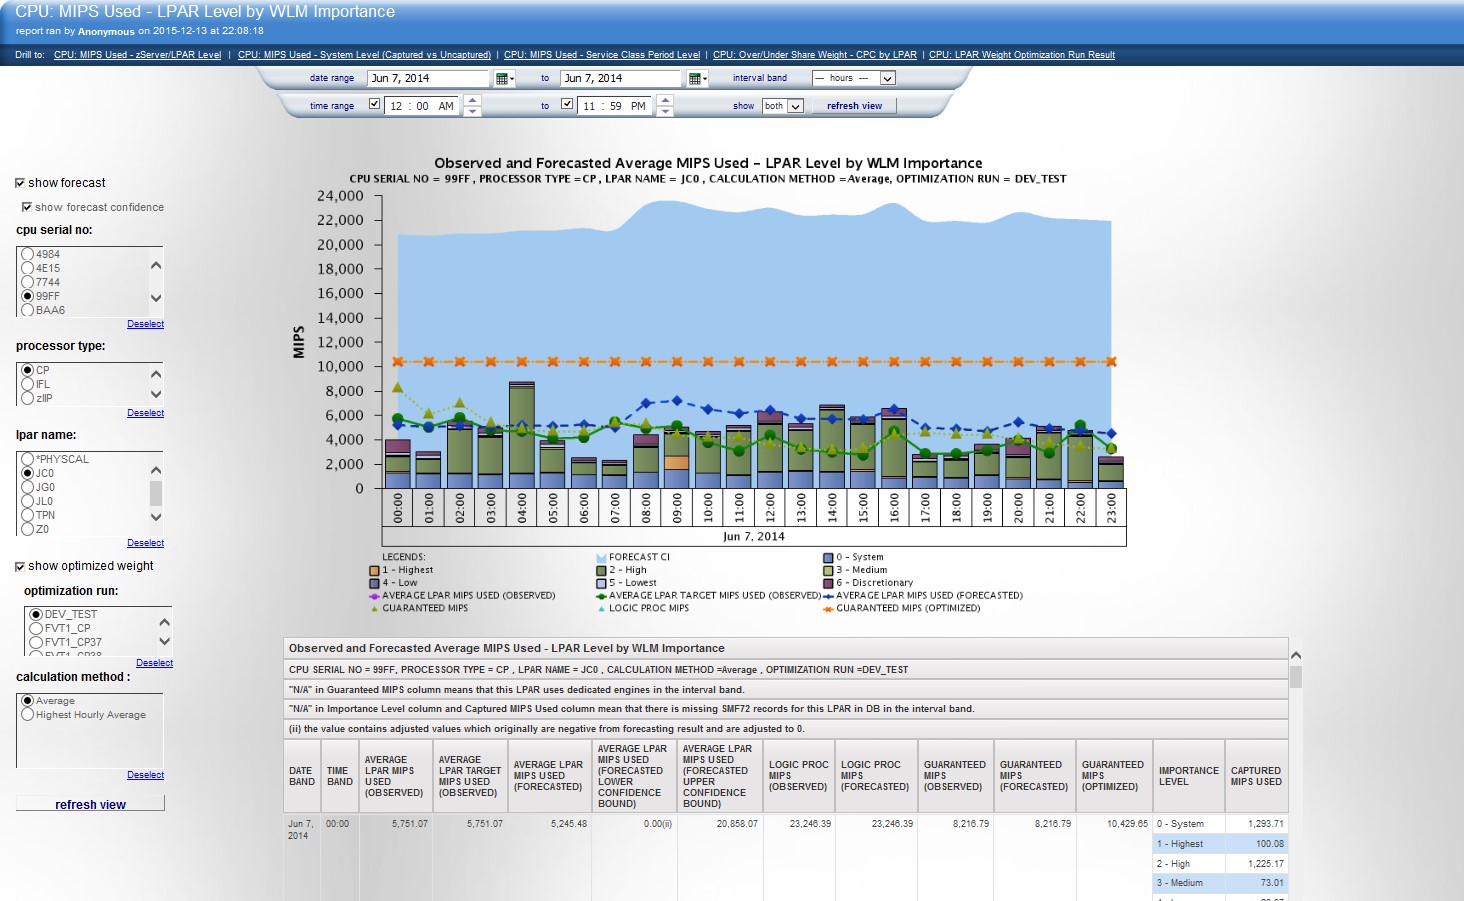
This report shows the observed average or peak CPU MIPS used at the LPAR level and the forecasted average or peak with their confidence intervals. The CPU MIPS used (both observed and forecasted) can be displayed for each processor type at each interval band. The observed CPU MIPS used is also broken down by the WLM importance level. The optimized LPAR weight and the target workload, according to the settings in the selected optimization run, can be also displayed.
The overall usage is shown in MIPS of the LPAR by stacking the usage that is attributed to the workloads that are running in WLM importance levels. The chart shows a reference line that represents the amount of MIPS that the hypervisor attempts to guarantee as available for this LPAR. The configured Weight value for the LPAR is used to determine the guarantee line. If other LPARs are using all of their guaranteed amount of capacity, then the LPAR being viewed must fit its workload demand within the guaranteed amount of capacity. WLM manages the prioritization of work based on the goals and priorities that are established by the customer. WLM defers the lower priority work and attempts to achieve the goals of the higher priority work with the capacity that is available.
By stacking the workload by Importance level order and showing the guarantee line, the report shows you what priority work is at risk by running over the guarantee line. If it shows any importance level work running over the guarantee line, then that work is at risk of not having capacity available if other LPARs use more of their capacity.
By setting up the WLM rules, you can define what work runs at what Importance level. You can use this chart to ensure that the Weight values for each LPAR are satisfying the needs of the important work as you have defined it. If your higher priority workload is consistently running above the guarantee line, then it is time to evaluate the LPAR’s weight value setting.
The peak value for the selected LPAR is shown for each interval band, and the values of each WLM importance level are stacked. The peak time (by hour or SMF interval) is shown if the user chooses to show the peak usage.
- Source table
- [Presentation View].[LPAR Level Metrics]
- [Presentation View].[LPAR Level Forecast Metrics]
- [Presentation View].[WLM Service Class Period Usage/Delay Metrics]
- [Presentation View].[LPAR Weight Optimization Metrics]
- Drill through to the following reports
- CPU: MIPS Used - zServer/LPAR Level
- CPU: MIPS Used - System Level (Captured vs Uncaptured)
- CPU: MIPS Used - Service Class Period Level
- CPU: Over/Under Share Weight - CPC by LPAR
- CPU: LPAR Weight Optimization Run Result
- Standard prompts:
- date range
- time range
- interval band (If an interval band of less than one day is selected, and peak usage is shown, then the calculation uses an interval band of one day for the calculation.)
- show
- Report-specific prompts
- show forecast
- cpu serial no
- processor type
- lpar name
- show optimized weight
- optimization run
calculation method
Three calculation methods are available: Average, Highest Hourly Average, and Percentile of SMF Interval. Percentile of SMF Interval is not available when show forecast is selected.
calculation value
This prompt is shown only if you select Highest Hourly Average or Percentile of SMF Interval as the calculation method.
If you select Highest Hourly Average, the values are:
- Highest Hourly Average
- 2nd Highest Hourly Average
- 3rd Highest Hourly Average
- 4th Highest Hourly Average
- 5th Highest Hourly Average
If you select Percentile of SMF Interval, the values are:
- 100%ile of SMF Interval
- 95%ile of SMF Interval
- 90%ile of SMF Interval
- 85%ile of SMF Interval
- 80%ile of SMF Interval
- 75%ile of SMF Interval
- 70%ile of SMF Interval
The Observed Average MIPS Used - LPAR Level by WLM Importance and Observed Peak MIPS Used - LPAR Level by WLM Importance charts or tables contains the following information:
- cpu serial no
- The zServer/CEC serial number.
- processor type
- The engine type: CP, zIIP, zAAP, IFL, or ICF. The list contains only installed processor types.
- lpar name
- The name of the logical partition to which the specified processor type is assigned.
- DATE BAND
- The start date of the time interval.
- PEAK DATE
- The date when the peak period occurs.
- This value is displayed only when the calculation method is Highest Hourly Average or Percentile of SMF Interval.
- PEAK TIME
- The start time of the peak period.
- This value is displayed only when the calculation method is Highest Hourly Average or Percentile of SMF Interval.
- TIME BAND
- The start time of the time interval.
- This value displays only when the calculation method is Average.
- AVERAGE LPAR MIPS USED
- The average MIPS usage for the selected LPAR.
- This value displays only when the calculation method is Average.
- If the SMF72 records for this LPAR in the interval band are missing from the database, a "(i)" marker is shown beside the AVERAGE LPAR MIPS USED value and a footnote is displayed on the top of the table stating: "(i) there is missing SMF72 records for this LPAR in DB in the interval band, and the MIPS value is normalized to the whole interval."
- PEAK LPAR MIPS USED
- The peak MIPS usage for the selected LPAR.
- This value is displayed only when the calculation method is Highest Hourly Average or Percentile of SMF Interval.
- If the SMF72 records for this LPAR in the interval band are missing from the database, a "(i)" marker is shown beside the PEAK LPAR MIPS USED value and a footnote is displayed on the top of the table stating: "(i) there is missing SMF72 records for this LPAR in DB in the interval band, and the MIPS value is normalized to the whole interval."
- LOGIC PROC MIPS
The logical processors MIPS value is the MIPS capacity of the logical processors that are assigned to this LPAR
If this value is double the maximum of the total MIPS usage, then this line does not appear in the chart. Showing the line would make the chart appear small.
- GUARANTEED MIPS (OBSERVED)
- The guaranteed capacity in MIPS on this LPAR. The value is calculated according to the weight assigned to this LPAR.
- If dedicated processors are assigned to this LPAR, then this line does not appear in the chart and the value is shown as N/A in the table.
- If this value is double the maximum of the total MIPS usage, then this line does not appear in the chart. Showing the line would make the chart appear small.
- GUARANTEED MIPS (OPTIMIZED)
- The guaranteed capacity in MIPS on this LPAR. The value is calculated according to the optimized weight assigned to this LPAR.
- This value is displayed only when show optimized weight is selected.
- AVERAGE LPAR TARGET MIPS USED
- The average LPAR target MIPS usage at each time interval. The target setting is in the setting of the selected optimization run.
- This value is displayed only when show optimized weight is selected and the calculation method is Average.
- If the SMF72 records for this LPAR in the interval band are missing from the database, a "(i)" marker is shown beside the AVERAGE LPAR MIPS USED value and a footnote is displayed on the top of the table stating: "(i) there is missing SMF72 records for this LPAR in DB in the interval band, and the MIPS value is normalized to the whole interval."
- PEAK LPAR TARGET MIPS USED
- The peak LPAR target MIPS usage at each time interval. The target setting is in the setting of the selected optimization run.
- This value is displayed only when show optimized weight is selected and the calculation method is Highest Hourly Average or Percentile of SMF Interval.
- If the SMF72 records for this LPAR in the interval band are missing from the database, a "(i)" marker is shown beside the PEAK LPAR MIPS USED value and a footnote is displayed on the top of the table stating: "(i) there is missing SMF72 records for this LPAR in DB in the interval band, and the MIPS value is normalized to the whole interval."
- IMPORTANCE LEVEL
- The WLM importance level assigned to a service class period.
- CAPTURED MIPS USED
- The CPU time that is consumed by serviceclass_period, converted to MIPS used.
The Observed and Forecasted Average MIPS Used – LPAR Level by WLM Importance and the Observed and Forecasted Peak MIPS Used – LPAR Level by WLM Importance charts and tables contain the information that is shown in the Observed Average MIPS Used - LPAR Level by WLM Importance and Observed Peak MIPS Used - LPAR Level by WLM Importance charts and table, as well as the following information:
- PEAK DATE (FORECASTED)
- The date when the forecasted peak of the time interval occurs.
- This value is displayed only when the calculation method is Highest Hourly Average.
- PEAK TIME (FORECASTED)
- The time when the forecasted peak of the time interval occurs.
- This value is displayed only when the calculation method is Highest Hourly Average.
- AVERAGE LPAR MIPS USED (FORECASTED)
- The forecasted average MIPS usage for the selected LPAR.
- This value is displayed only when the calculation method is Average.
- AVERAGE LPAR MIPS USED (FORECASTED LOWER CONFIDENCE BOUND)
- The lower confidence bound of the forecasted MIPS.
- AVERAGE LPAR MIPS USED (FORECASTED UPPER CONFIDENCE BOUND)
- The upper confidence bound of the forecasted MIPS.
- Values that are marked with an asterisk (ii) are adjusted values. These values were originally negative in the forecasting result and are adjusted to 0.
- Values that are marked with an asterisk (iii) are adjusted values. These values were originally extremes in the forecasted result and are adjusted to the maximum forecasted value.
- LOGIC PROC MIPS (FORECASTED)
- The forecasted MIPS capacity of the logical processors that are assigned to this LPAR.
- If this value is double the maximum of the total MIPS usage, then this line does not appear in the chart. Showing the line would make the chart appear small.
- GUARANTEED MIPS (FORECASTED)
- The forecasted guaranteed capacity in MIPS on this LPAR.
- If this value is double the maximum of the total MIPS usage, then this line does not appear in the chart. Showing the line would make the chart appear small.
The Forecast Metadata table contains the following information. This table is displayed when the show forecast prompt is selected and Highest Hourly Average is selected as calculation method.
- STREAM TYPE
- The stream type that is used by the available forecast results set, for example lpar_mips_peak_daily. This means that the stream is for the lpar mips forecast, and it forecasts the CPU seconds at the daily peak aggregation level.
- AGGREGATION
- The aggregation level of the available forecast results set. The values are: Highest Hourly Average of LPAR MIPS Daily, 2nd Highest Hourly Average of LPAR MIPS Daily, 3rd Highest Hourly Average of LPAR MIPS Daily, 4th Highest Hourly Average of LPAR MIPS Daily, and 5th Highest Hourly Average of LPAR MIPS Daily.
- HOUR START
- The start hour of the forecasted hour range of the available forecast results set.
- HOUR END
- The end hour of the forecasted hour range of the available forecast results set.
- HISTORY START
- The start date of the based historical data range of the available forecast results set.
- HISTORY END
- The end date of the based historical data range of the available forecast results set.
- FORECAST START
- The start date of the available forecast results set.
- FORECAST END
- The end date of the available forecast results set.
- EXECUTE TIMESTAMP
- The forecast execution timestamp of the available forecast results set.
- MAPPING TIMESTAMP
- The last updated timestamp of the mapping table on which the forecast is based.
The rules to choose the forecast stream aggregation level when show forecast is selected are:
If you select the Average calculation method:
If you select daily, quarterly, or yearly, and a daily stream is available, then it is used. Otherwise, no data available is displayed.
If you select monthly and a monthly stream is available, then it is used. Otherwise, no data available is displayed.
If you select hourly and an hourly stream is available, then it is used. Otherwise, no data available is displayed.
If you select the Highest Hourly Average calculation method:
If you select Highest Hourly Average calculation value and a Highest Hourly Average of LPAR MIPS Daily stream is available, then it is used. Otherwise, no data available is displayed.
If you select 2nd Highest Hourly Average calculation value and a 2nd Highest Hourly Average of LPAR MIPS Daily stream is available, then it is used. Otherwise, no data available is displayed.
If you select 3rd Highest Hourly Average calculation value and a 3rd Highest Hourly Average of LPAR MIPS Daily stream is available, then it is used. Otherwise, no data available is displayed.
If you select 4th Highest Hourly Average calculation value and a 4th Highest Hourly Average of LPAR MIPS Daily stream is available, then it is used. Otherwise, no data available is displayed.
If you select 5th Highest Hourly Average calculation value and a 5th Highest Hourly Average of LPAR MIPS Daily stream is available, then it is used. Otherwise, no data available is displayed.