Capacity reporting changes for devices that use hardware compression
For storage systems that use hardware compression, as of Q4 2020 capacity usage is now reported based on the physical capacity rather than the effective capacity of the storage system.
- Storage systems such as FlashSystem 9100, FlashSystem 900, and Storwize® V7000 Gen3, which contain IBM FlashCore® Modules with hardware compression
- SAN Volume Controller and Storwize storage systems that are configured as storage virtualizers, and which use back-end storage systems with hardware compression
Two sets of capacity values are now shown for storage systems and pools. To help you see whether you are running out of space, the existing capacity columns, such as Pool Capacity (GiB), and Physical Allocation (%), now show physical capacity values. New columns were added to show the effective capacity based on the data reduction savings that are achieved with hardware compression.
- In capacity views, reports, and charts, you'll see a sharp drop in the values for capacity because capacity is now reported based on physical capacity.
- Alert thresholds might need to be adjusted for storage systems and pools.
- Capacity values such as shortfall percentage and zero capacity now use physical capacity rather
than effective capacity. Zero Capacity: Because the reporting of physical capacity values has changed, wait about seven days before you check the projected values for zero capacity. The estimation of zero capacity is based on historical usage trends.
Alert updates
- Pool Capacity
- Physical Allocation
- Available Pool Space
- Allocated Space
New alerts are available to monitor the effective capacity values. Check for alerts that begin with Effective.
Changes to capacity columns for block storage systems and pools
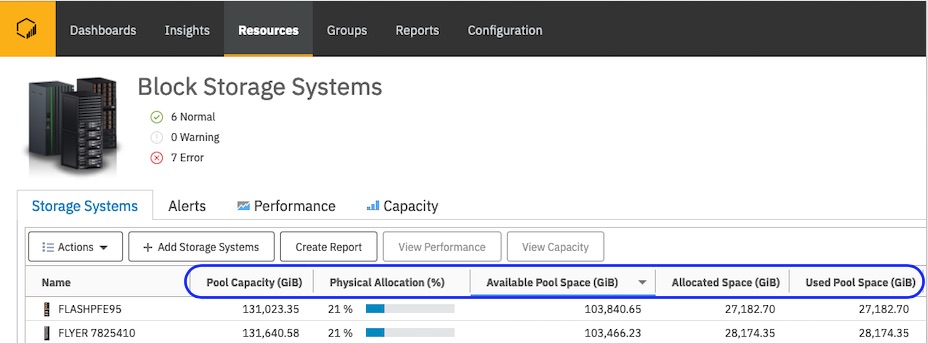
- Block Storage Systems page
- The following screen capture shows the capacity columns that were updated
to show the physical capacity of the device, rather than the effective capacity.
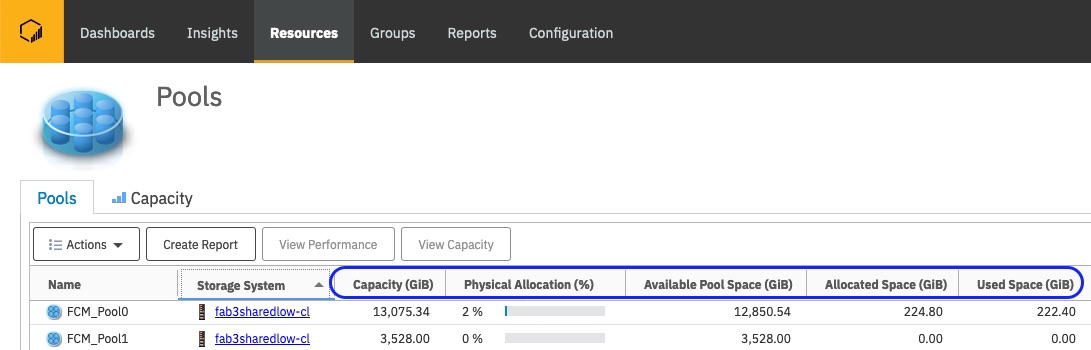
- Pools page
- The following screen capture shows the capacity columns that were updated
to show the physical capacity, rather than the effective capacity.
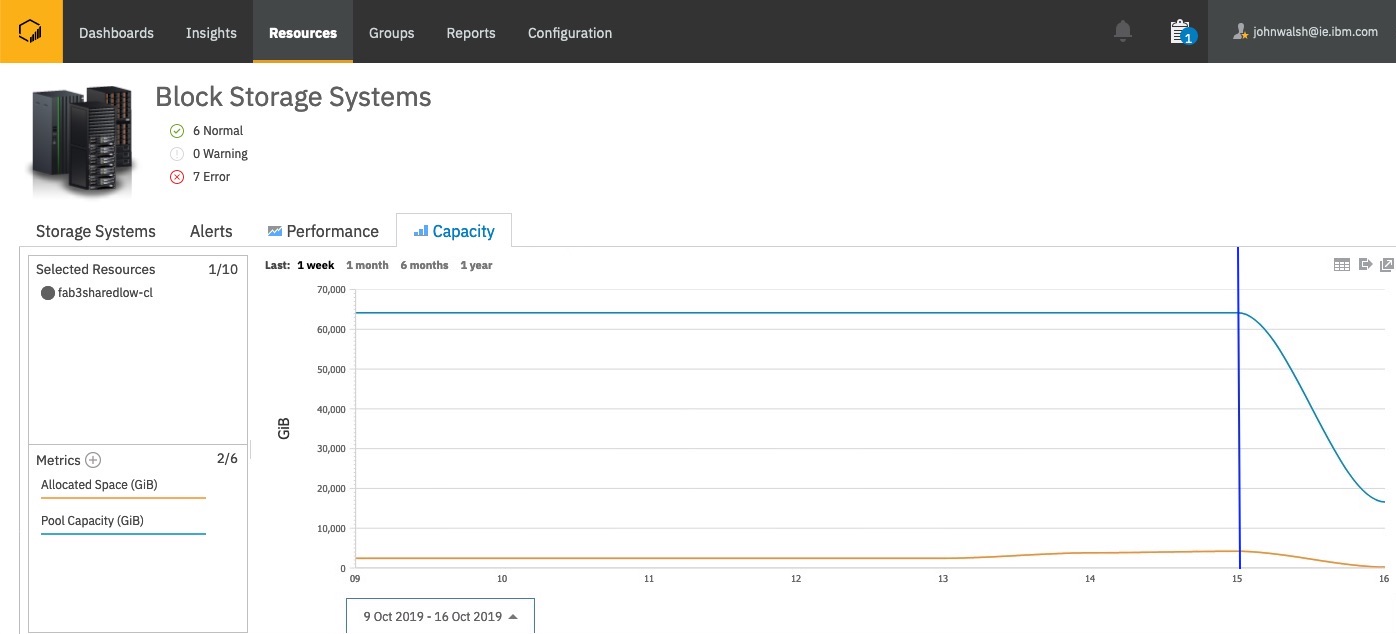
Changes to historical charting
In historical capacity charts for storage systems and pools, you'll see a sharp drop in the values for capacity, allocated space, and available pool space. That's because capacity values are now measured based on the physical capacity rather than the effective capacity. Before, for example, the capacity value measured for your device was 250 TiB. Now it's 100 TiB. That's because the capacity savings achieved by hardware compression are no longer included when capacity is measured.
In the following chart, the blue vertical line represents the point at which IBM Storage Insights is updated.
The chart values before the update represent the effective capacity, which includes data reduction savings; the values after the update represent the physical capacity, which is lower.
The effective capacity metrics are still available. To add the metrics to the chart, click
Select Chart Metrics
![]() and add the
metrics that begin with Effective.
and add the
metrics that begin with Effective.
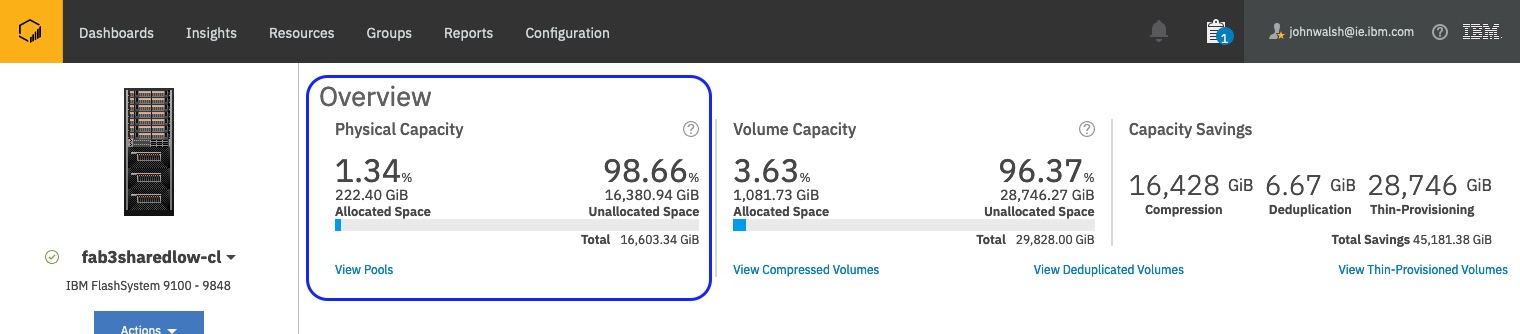
Changes to capacity overview chart
The Physical Capacity chart for storage systems now shows physical capacity values rather than effective capacity. After the update, you'll see a sharp drop in the allocated, unallocated, and total space values that are shown on the chart.