Troubleshooting using log files
You can enable logging for IBM Z Open Editor to produce detailed logs that can be used to troubleshoot problems. Logs can be valuable inputs when you file defects or contact technical support (if you are entitled to it). You can enable logging via a user preference setting called zopeneditor.logger. In the VS Code Preferences editor, select from the allowed log levels: DEBUG, INFO (default), WARNING, ERROR and OFF.
Once logging is enabled, you can find the logging output in two places:
In the VS Code Output panel, by selecting
IBM Z Open Editorfrom the drop-down.A log file written to your disk. More details on the logs for IBM Z Open Editor and its integrations can be found further below.
If you use IBM Z Open Editor with Eclipse Che or Red Hat® CodeReady Workspaces, you can also enable logging by specifying the same user preference setting, zopeneditor.logger. To find the generated log file, open a Terminal window in the container called ibm-wazi???, with the question marks being replaced by randomly generated characters. Do not mistake that with the default user content container called wazi, which you use for coding.
Finding versions of all VS Code extensions installed
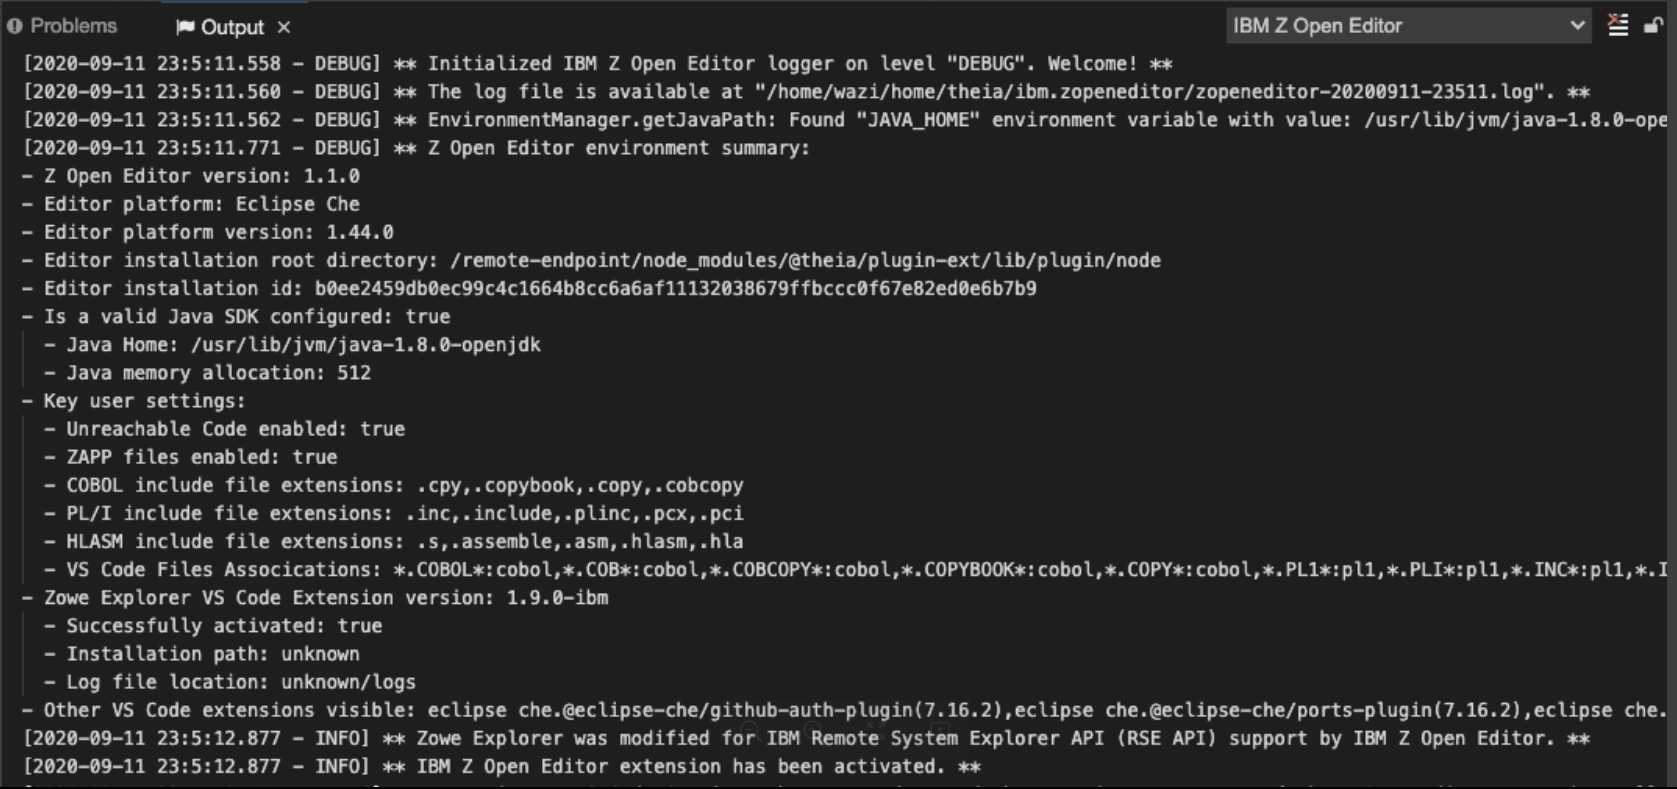
Ensure that your IBM Z Open Editor logger preference is set to
DEBUG.In the
Outputconsole window, selectIBM Z Open Editorfrom the drop down list. The following information will be listed:IBM Z Open Editor version
Editor platform and version
Editor Installation information
Java™ SDK configuration location and memory allocation
Key user settings
Zowe™ Explorer VS Code Extension version
Other VS Code Extensions visible
Locating VS Code extension and LSP log files on the local client
| Log type | Location |
|---|---|
| Main log | The location is specified in output console window on 2nd line. ** The log file is available at...
|
| Language Server Protocol (LSP) log | Find the line that begins with the following sentence to locate the LSP logs: ** ZLanguageServer: Will start a language server with command... Then, find the -data, tag which immediately precedes the LSP log file location.
|
| Zowe Explorer log |
|
| RSE API plug-in for Zowe CLI (RSE CLI plug-in) logs | Log files can be found in two locations:
|
| Z Open Debug log | Log files can be found in the user's home directory. To extract the location of the log path, complete the followings steps:
|
Finding Zowe CLI version and RSE CLI plug-in version
In the VS Code Terminal window, enter the applicable commands:
Command for Zowe CLI:
zowe --versionCommand for RSE CLI plug-in:
zowe plugins list
Log levels
IBM Z Open Editor uses the log levels described in the following chart. These levels are listed in order of most to least detailed (with the exception of OFF, which turns off all logging). For example, the DEBUG setting will output detailed debug information, as well as messages from the other levels below it: INFO, WARN, and ERROR. In contrast, the ERROR setting will only log important errors.
| Log level | Description |
|---|---|
| Debug | Identifies detailed informational events that are useful for troubleshooting the editor's behavior. |
| Info | Provides informative messages that are of general interest to the end user for observing activities performed by the editor. |
| Warn | Indicates potentially problematic situations that could cause unexpected behaviors or errors. |
| Error | Designates error events that interrupted the editor in executing an operation as intended. |
| Off | Nothing is logged. |