Record data that is flowing through a message flow, or that is emitted by WebSphere® Application
Server.
- Create and configure a database.
- Configure security settings.
- Create appropriate configurable services.
- Configure monitoring for the message flow.
Before you start:
Ensure that the message flow for which you want to record data has been deployed. For more information, see Deploying resources.
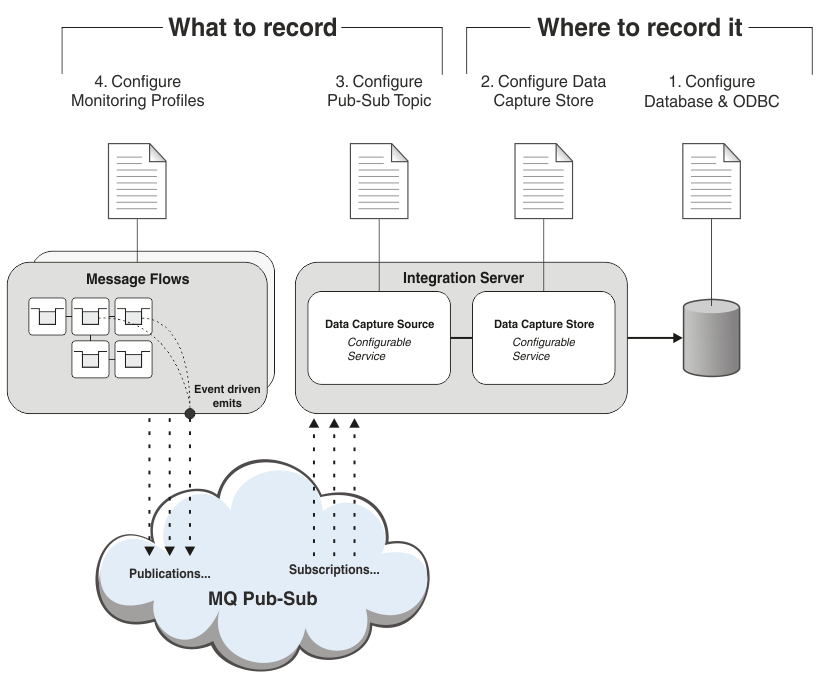
You can record data to a database for audit purposes, or to help with problem determination. To record data, you must identify the source of the data that you want to record and the place that you want to record it to. The steps that you take to record data are shown in the following diagram:
To configure IBM® Integration Bus to record data, complete the following steps. The sequence of these steps is important. If they are not completed exactly as shown, then BIP Message BIP2194 is generated on startup.
- Create and configure your database, and define an ODBC definition for the data source name (DSN). Specify an ID and password for your broker to use when connecting to the database. See Creating and configuring a database for recording data.
- Configure your data capture store.
To define how and where data is stored, create a DataCaptureStore configurable service. This configurable service specifies the broker runtime properties for data processing and for connecting to the database.
Your record and replay topology can include more than one broker. If you deploy the message flows for which you want to capture data to one broker, and use a different broker to record the data, you must connect the two brokers. For more information about how you can configure your broker topology, see Using multiple brokers for record and replay.
You can use the provided DefaultCaptureStore configurable service or create your own configurable service of type DataCaptureStore. You can use the IBM Integration Explorer to create the configurable service; for more information, see Using the IBM Integration Explorer to work with configurable services. Alternatively, use the mqsicreateconfigurableservice command; for more information, see mqsicreateconfigurableservice command. For descriptions of properties of this configurable service, see DataCaptureStore configurable service.
For example, enter the following command on a command line:
mqsicreateconfigurableservice brokerName -c DataCaptureStore -o dataCaptureStoreName
 -n dataSourceName,egForRecord -v dataSource,integrationServer
- brokerName is the name of your broker. You configured this broker to connect to the database when you completed the steps in the topic Creating and configuring a database for recording data.
- dataCaptureStoreName is the name of your configurable service object.
- dataSource is the name of your data source.
- integrationServer is the name of the integration server that processes data for recording.
- Specify a publish/subscribe topic that identifies the source of the data that you want to capture.
To identify the source of the data, create a DataCaptureSource configurable service. You use this configurable service to specify the monitoring topic that identifies the messages flows from which your data comes, and the data capture store to use for storing this data. Multiple instances of the DataCaptureSource configurable service can use the same DataCaptureStore configurable service.
You can use the IBM Integration Explorer or the mqsicreateconfigurableservice command to create the configurable service. If you use the DataCaptureSourceTemplate in IBM Integration Explorer, you must create a new configurable service based on the template. If you edit the template without creating a new configurable service, an error is issued at run time. For information about the properties of this configurable service, see DataCaptureSource configurable service.
For example, on UNIX systems, enter the following command on a command line:
mqsicreateconfigurableservice brokerName -c DataCaptureSource -o dataCaptureSourceName
-n dataCaptureStore,topic
-v dataCaptureStoreName,'$SYS/Broker/myBroker/Monitoring/integrationServerName/msgFlowName'
- brokerName is the name of your broker.
- dataCaptureSourceName is the name of the configurable service object.
- dataCaptureStoreName is the name of the DataCaptureStore configurable service that you want to use for this subscription. You must use brokerName to create this DataCaptureStore configurable service.
- myBroker, integrationServerName, and msgFlowName are the names of the broker, integration server, and message flow from which you want to capture data. These values are part of a topic string, which is used to subscribe to events that you set up by using business monitoring. You can use topic wildcards in this topic string. On UNIX systems, enclose the topic string in single quotation marks when you enter it on a command line. On Windows systems, use double quotation marks. No quotation marks are required if you create the configurable service by using the IBM Integration Explorer.
For events that are emitted by
WebSphere Application
Server, the
WebSphere Application
Server administrator must supply details of the topic, for example:
$SYS/AppServer/exampleCell02Cell/exampleNode03.server1/#
For more information about how monitoring is used for capturing data, see Configuring monitoring for data capture.
Test that your subscription to the topic specified in the topic property was successful by retrieving the subscriptions on the queue manager for brokerName. Use IBM Integration Explorer or the runmqsc command.
To check the subscriptions by using the
IBM Integration Explorer, complete the following steps:
- Expand the queue manager under the Queue Managers folder
- To open the Subscriptions pane, click Subscriptions.
- Click Refresh and check that a subscription with a topic string of $SYS/Broker/myBroker/Monitoring/integrationServerName/msgFlowName exists
To check the subscription by using
runmqsc, complete the following steps:
- At a command prompt, type runmqsc qmName, where qmName is your queue manager name.
- To display all the queue manager subscriptions, type dis sub(*)
- Check that the topic name is returned in the list of subscription topics, for example SUB(myBroker:myTopic)
- To exit the runmqsc environment, type end
- To generate the data that you want to record, configure monitoring on your message flows. See Configuring monitoring for data capture.


 Last updated Friday, 21 July 2017