Tutorial: Downloading and configuring a data collector

Use this tutorial to gain hands-on experience with downloading and configuring a Cloud APM Bluemix® Ruby data collector from IBM® Marketplace. You can then start the Cloud APM console and check the health of your monitored resource by viewing key performance indicators (KPIs) in the dashboards.

About this task

This tutorial involves downloading the data collector package for Bluemix applications from the Products and services page on IBM Marketplace, extracting the configuration files, and configuring the Bluemix Ruby data collector on a Linux® system. You return to Products and services to launch the Cloud APM console and open the Application Performance Dashboard to check the health of your Bluemix Ruby application.

Procedure

  1. If you are not signed in to IBM Marketplace, sign in with your IBMid and password and go to Products and services.
    The Products and services page is available to active subscribers. If you have any issues, go to the Cloud Application Performance Management Forum or to Marketplace support.
  2. Download the Data Collectors for Bluemix Applications package IBM_Bluemix_Data_Collectors_Install.tgz.
  3. On your local system, navigate to the directory where you saved the downloaded archive file and extract it by running the following command:
    tar -zxvf IBM_Bluemix_Data_Collectors_Install.tgz
    You get four compressed files, each representing a data collector for a type of Bluemix application. The data collector package for Bluemix Ruby applications is ruby_datacollector.tgz.
  4. Extract the files in ruby_datacollector.tgz by running the following command, for example:
    tar -zxvf ruby_datacollector.tgz
    You get an ibm_ruby_dc folder.
  5. Copy the entire etc folder in ibm_ruby_dc to the root folder of your Ruby application by running the following command, for example:
    cp –r directory to the etc folder  home directory of your Ruby application

    If you extract the data collector to the /opt/ibm/ccm/ibm_ruby_dc/etc directory and the home directory of your Ruby application is /root/ruby_app/, the command is as follows:

    cp –r /opt/ibm/ccm/ibm_ruby_dc/etc /root/ruby_app/
  6. Add the following section to the Gemfile in the home folder of your Bluemix Ruby application:
    gem 'logger',  '>= 1.2.8'
    source 'https://managemserver.ng.bluemix.net' do
      gem 'ibm_resource_monitor'
      gem 'stacktracer'
    end
  7. Run the bundle lock command to regenerate the Gemfile.lock file.
  8. From the home directory of your Ruby application, run the following command:
    cf push
  9. Return to Products and services on IBM Marketplace and click Launch from the Cloud APM subscription box.
    The Cloud APM console opens to the Getting Started page where you can learn about the features, watch videos for different user scenarios, and open the associated console pages.
  10. On the Getting Started page, click Take a tour of the performance management dashboard for a quick tour of the navigation elements.
    Getting started page with tour link highlighted.
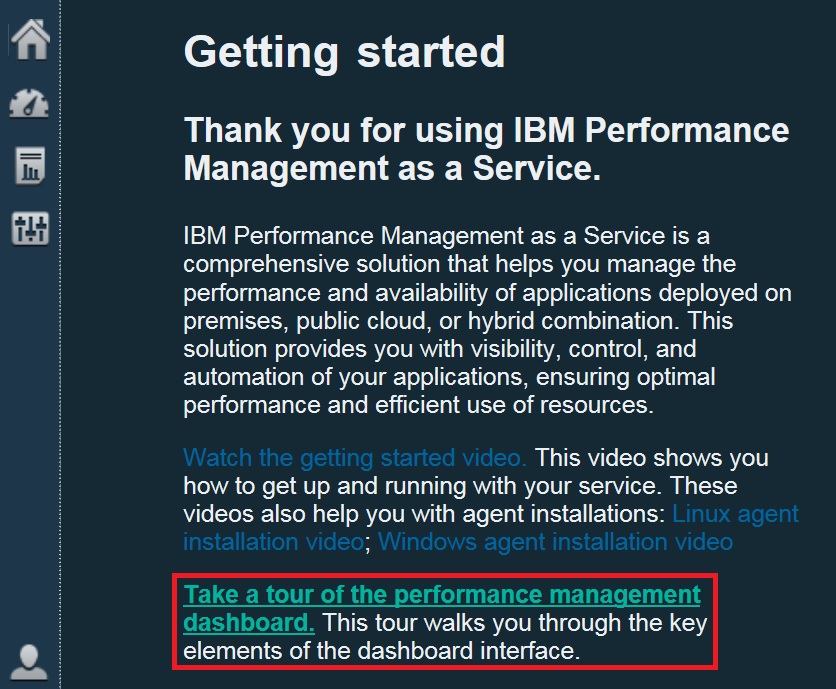
  11. Open the Bluemix Ruby applications summary dashboard:
    1. From the navigation bar, click dial icon Performance > Application Performance Dashboard.
      • The All My Applications dashboard is displayed with a summary status box for each defined application in your environment. Initially, only the My Components predefined application is displayed.
      • If you see an Add Application window instead of My Components, create an application to see your monitored resource:
        1. Enter a name for the application, such as My Apps.
        2. Click Add.
        3. Click Bluemix Ruby Application.
        4. In the Component Editor, select an instance, click Add, and click Back to add your data collector to the application.
        5. Click Save to close the window and view a summary status box for your new application in the dashboard.
    2. In the summary box, click Components icon Components.
      • The summary dashboard for your Bluemix Ruby application is displayed. From here, you can click anywhere in the status summary group widget to drill down to detailed dashboards with KPIs reported from your Bluemix Ruby data collector.
      • It can take a few minutes for a newly started data collector to communicate with the monitoring infrastructure and send KPIs to the console.
    Bluemix component dashboard page with status overview widget.

Results

You installed a Cloud APM data collector and observed monitoring data that is sent to the Application Performance Dashboard.

What to do next

  • Explore the console: While you are using the Cloud APM console, explore the features. You can learn about the current dashboard by clicking Help icon 
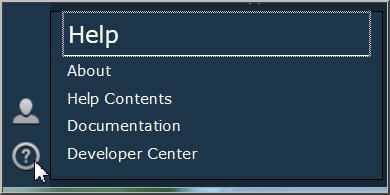
in the window banner. You can open the help system or the Cloud APM topic collection on IBM Knowledge Center from the Help icon Help menu in the navigation bar.
    Navigation bar Help icon and menu options
  • Install other data collectors: You have all the installation files that you need to install other types of data collectors for monitoring your environment. You can also install data collectors on other systems in your environment. For more information, see Configuring your environment.