Running the Analysis
- To identify unusual cases, from the menus
choose:
Figure 1. Identify Unusual Cases dialog box, Variables tab 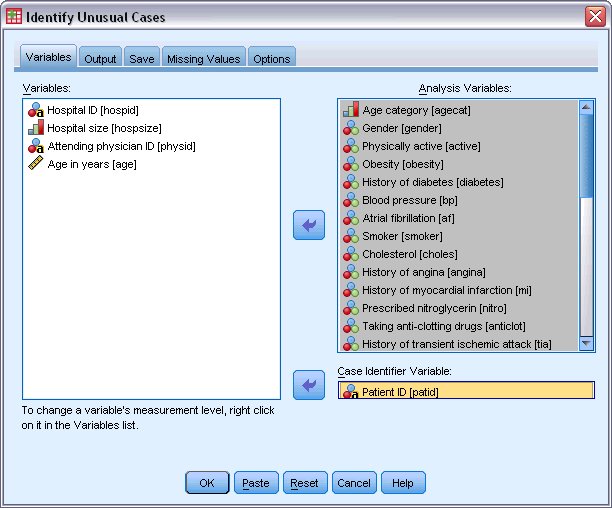
- Select Age category through Stroke between 3 and 6 months as analysis variables.
- Select Patient ID as the case identifier variable.
- Click the Output tab.
Figure 2. Identify Unusual Cases dialog box, Output tab 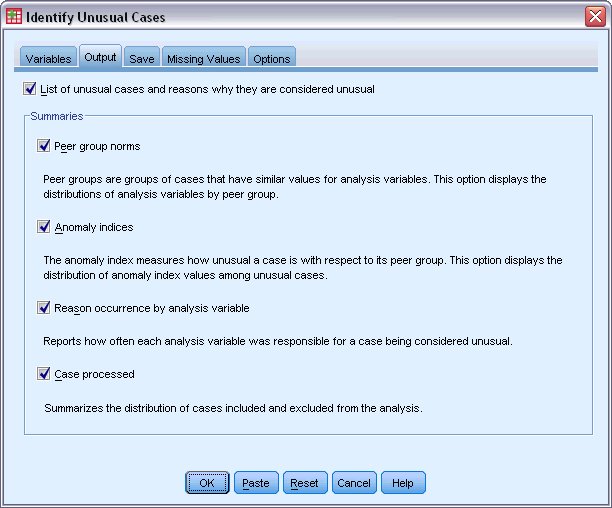
- Select Peer group norms, Anomaly indices, Reason occurrence by analysis variable, and Cases processed.
- Click
the Save tab.
Figure 3. Identify Unusual Cases dialog box, Save tab 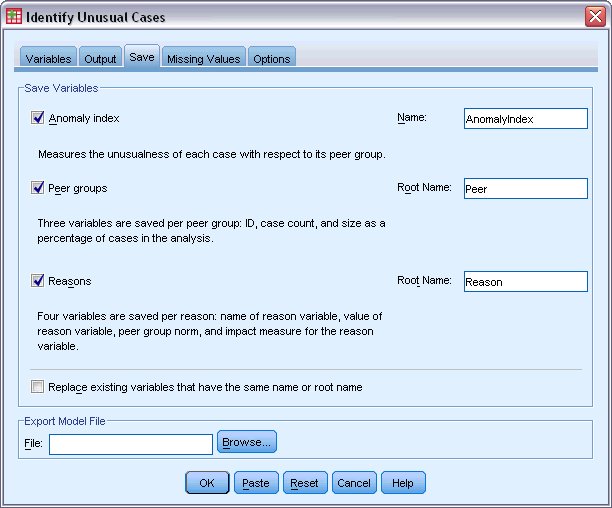
- Select Anomaly index, Peer groups, and Reasons.
Saving these results allows you to produce a useful scatterplot that summarizes the results.
- Click the Missing Values tab.
Figure 4. Identify Unusual Cases dialog box, Missing Values tab 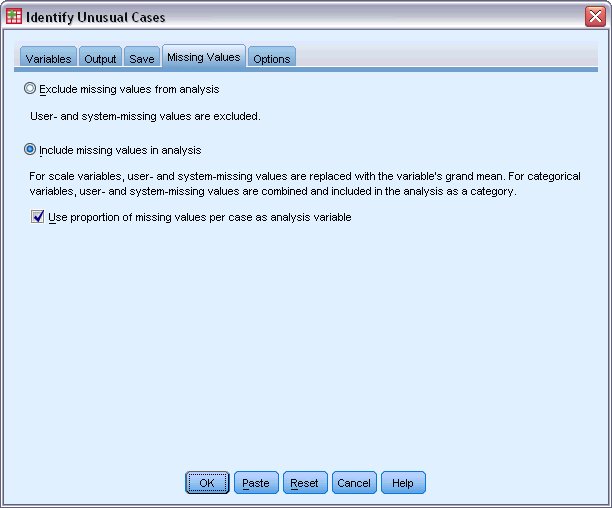
- Select Include missing values in analysis. This process is necessary because there are a lot of user-missing values to handle patients who died before or during treatment. An extra variable that measures the proportion of missing values per case is added to the analysis as a scale variable.
- Click the Options tab.
Figure 5. Identify Unusual Cases dialog box, Options tab 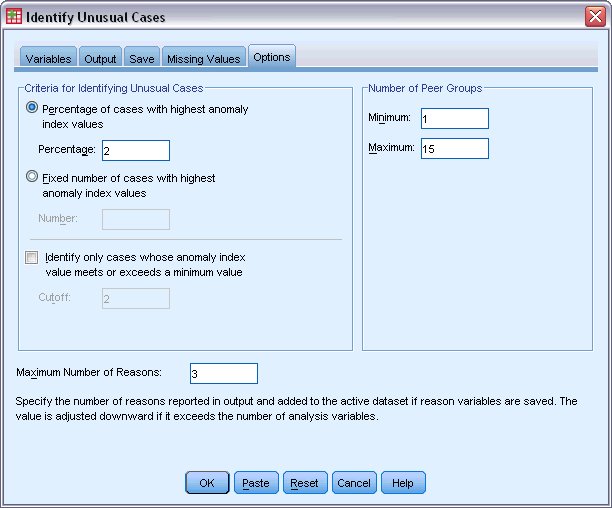
- Type 2 as the percentage of cases to consider anomalous.
- Deselect Identify only cases whose anomaly index value meets or exceeds a minimum value.
- Type 3 as the maximum number of reasons.
- Click OK.