Running the analysis
- To run a linear regression analysis, from
the menus choose: Figure 1. Linear Regression dialog box
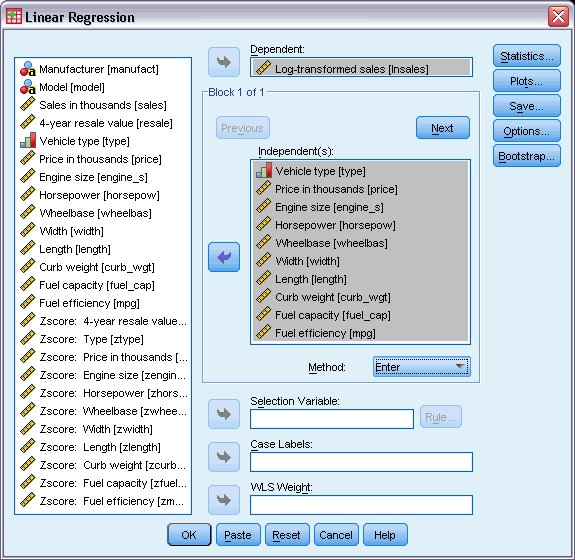
- Select Log-transformed
sales as the dependent variable.
The distribution of Log-transformed sales is closer to normal than Sales in thousands, and the linear regression model works better with normal variables.
- If the source variable list does not display variables in variable labels in file order, right-click anywhere in the list and select Display Variable Labels and Sort by File Order from the context menu.
- Select Vehicle type through Fuel efficiency as independent variables.
- Click Statistics.
Figure 2. Statistics dialog box
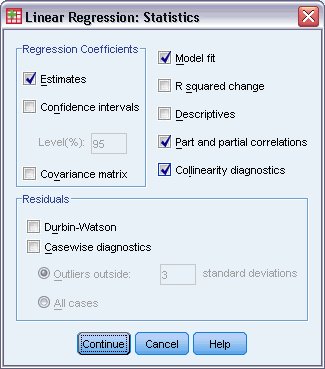
- Select Part and partial correlations and Collinearity diagnostics.
- Click Continue.
- Click OK in the Linear Regression dialog box.