Index Chart
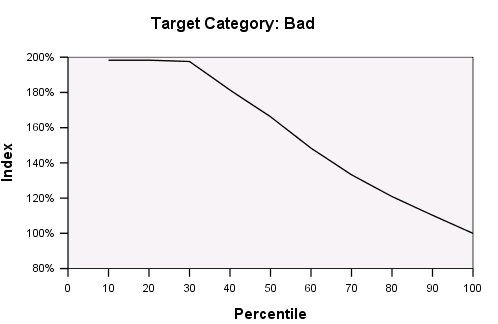
The index chart also indicates that the model is a good one. Cumulative index charts tend to start above 100% and gradually descend until they reach 100%.
For a good model, the index value should start well above 100%, remain on a high plateau as you move along, and then trail off sharply toward 100%. For a model that provides no information, the line will hover around 100% for the entire chart.