Sorting and Excluding Categories
This example uses the data file survey_sample.sav. See the topic Sample Files for more information.
By default, categories are displayed in the ascending order of the data values that the category value labels represent. For example, although value labels of Less than 25, 25 to 34, 35 to 44, ..., etc., are displayed for age categories, the actual underlying data values are 1, 2, 3, ..., etc., and it is those underlying data values that control the default display order of the categories.
You can easily change the order of the categories and also exclude categories that you don't want to be displayed in the table.
Sorting Categories
You can manually rearrange categories or sort categories in ascending or descending order of:
- Data values.
- Value labels.
- Cell counts.
- Summary statistics. The available summary statistics for sorting depends on the summary statistics you have selected to display in the table.
- Open the table builder (Analyze menu, Tables, Custom Tables).
- If Age category isn't already displayed in the Rows area on the canvas pane, drag and drop it there.
- Right-click Age category on the canvas pane and select Categories
and Totals from the pop-up menu.
Both data values and the associated value labels are displayed in the current sort order, which in this case is still ascending order of data values.
- In the Sort Categories group, select Descending from
the Order drop-down list.
The sort order is now reversed.
- Select Labels from the By drop-down list.
The categories are now sorted in descending alphabetical order of the value labels.
Notice that the category labeled Less than 25 is at the top of the list. In alphabetical sorting, letters come after numbers. Since this is the only label that starts with a letter and since the list is sorted in descending (reverse) order, this category sorts to the top of the list.
If you want a particular category to appear at a different location in the list, you can easily move it.
- Click the category labeled Less than 25 in the Label list.
- Click the down arrow to the right of the list. The category moves down one row in the list.
- Keep clicking the down arrow until the category is at the bottom of the list.
Excluding Categories
If there are some categories that you don't want to appear in the table, you can exclude them.
- Click the category labeled Less than 25 in the Label list.
- Click the arrow key to the left of the Exclude list.
- Click the category labeled 65 or older in the Label list.
- Click the arrow key to the left of the Exclude list again.
The two categories are moved from the Display list to the Exclude list. If you change your mind, you can easily move them back to the Display list.
- Click Apply and then click OK in the table builder to create the table.
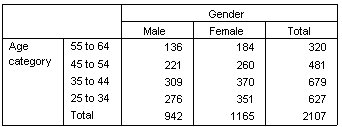
Notice that the totals are lower than they were before the two categories were excluded. This is because totals are based on the categories included in the table. Any excluded categories are excluded from the total calculation. See the topic Totals and Subtotals for Categorical Variables for more information.