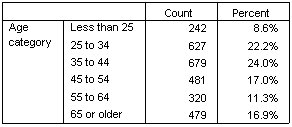
Percentages
In addition to counts, you can also display percentages. For a simple table of a single categorical variable, if the variable is displayed in rows, you probably want to look at column percentages. Conversely, for a variable displayed in columns, you probably want to look at row percentages.
- Open the table builder again (Analyze menu, Tables, Custom Tables).
- In the Summary Statistics group, deselect Hide for Position. Since this table will have two columns, you want to display the column labels so you know what each column represents.
- Right-click Age category on the canvas pane and select Summary Statistics from the pop-up menu.
- In the Summary Statistics dialog box, select Column N % in the Statistics list and click the arrow to add it to the Display list.
- In the Label cell in the Display list, delete the default label and type Percent.
- Click Apply to Selection and then click OK in the table builder to create the table.