IBM Trace and Request Analyzer for WebSphere Application Server
IBM Trace and Request Analyzer Creator/Developer
Jinwoo Hwang
jinwoo@us.ibm.com
Welcome to IBM Trace and Request Analyzer for WebSphere Application Server. IBM Trace and Request Analyzer for WebSphere Application Server allows you to find delays and possible hang from WebSphere trace files.
Acknowledgement
I appreciate the technical advice and requirement analysis from David Hare, Michael Lambert, Ashish Ghodasara, Christi Cain, Thu-Giang Pham, Ondrej Bizub and other colleagues and support from WebSphere Application Server Technical Support management team.
Prerequisite
- Java 6.0 Runtime Environment
�
Features
- Method Duration Analysis
- Request Response Analysis
- Trace Gap Analysis
- Custom Gap Analysis
How to enable traces for WebSphere Application Server
Please refer to the following document for detailed instruction on how to enable traces for WebSphere Application Server:
MustGather: Read first for all WebSphere Application Server products
http://www-1.ibm.com/support/docview.wss?uid=swg21145599
How to run IBM Trace and Request Analyzer for WebSphere Application Server
You need to use the Java Platform, Standard Edition 6 or higher Java Runtime Environment (JRE) to run IBM Thread and Monitor Dump Analyzer for Java Technology.
Usage <Java path>java –Xmx[heapsize] –jar tra<IBM Trace and Request Analyzer version>.jar
For example,
C:\java60\bin\java –Xmx200m –jar tra10.jar
=> Starts IBM Trace and Request Analyzer for WebSphere Application Server version 1.0
If your trace file uses different locale, you need to specify the specific locale that the trace file uses.
For example,� C:\java60\bin\java –Xmx200m –Duser.language=de –jar tra25.jar will start the version 2.5 to parse traces that use German locale.
If there’s a java.lang.OutOfMemoryError while you are processing trace files, please try increasing the maximum heap size (-Xmx) value to give the JVM more memory.
Maximum heap size should not be larger than the size of available physical memory size for this tool due to performance issue.
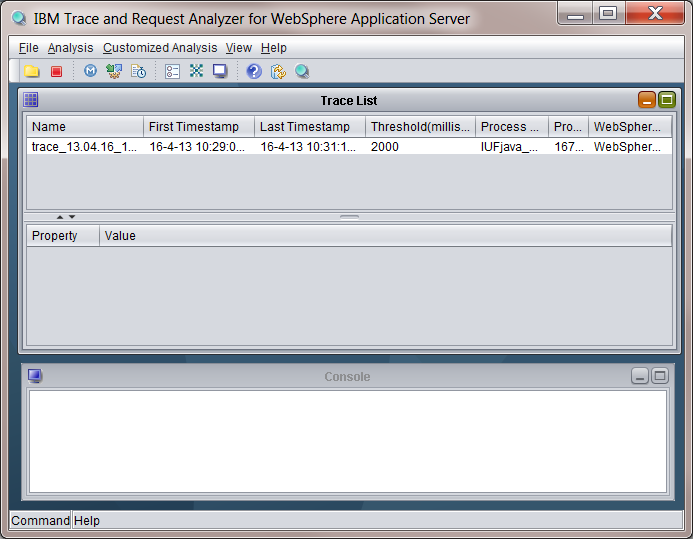
1. Start IBM Trace and Request
Analyzer for WebSphere Application Server
The following screen is a snapshot of the initial screen.

2. Select File-> Open WebSphere Trace
3.� Select trace file(s) that you want to analyze.
WARNING: If multiple files are selected, they are considered to be contiguous traces. Please do not select multiple files if they are not contiguous traces.

Select patterns, threshold, language and start analysis

4. Progress bars are shown

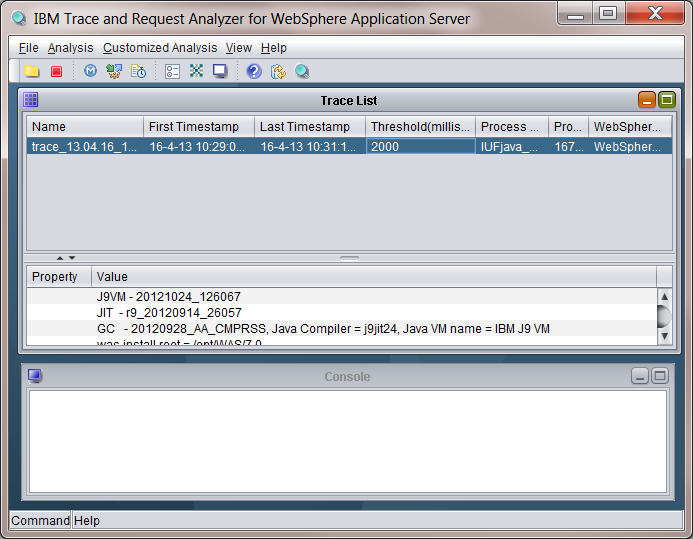
6. Loaded trace files are listed in the Trace List table.
7. Select a trace file to review Environment Information for the trace
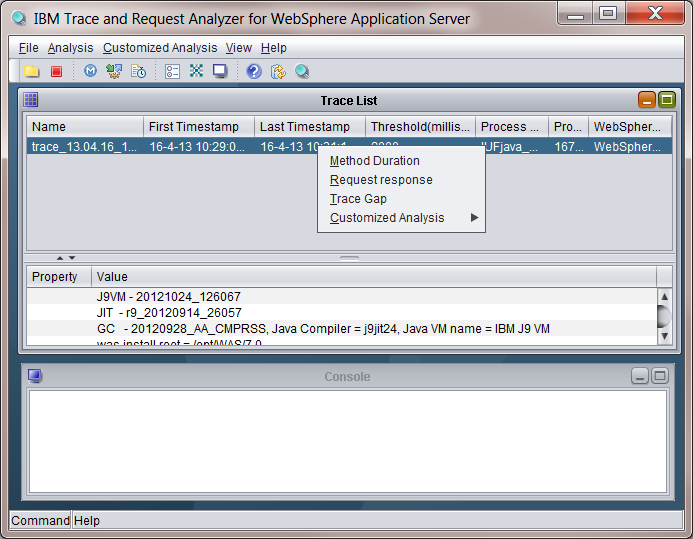
8. Click on Method Duration from Analysis menu or pop up menu
9. Method level delays are displayed with sorted time.
� Trace Method Analysis : Sorted list of trace method entry/exit taken longer than threshold
� Time: Time between trace method entry and exit of same thread id
� Trace: Actual line from trace file
� Line Number: Line number of the trace entry
� File : File name

10. Click on an entry to see actual trace entries

11. Click on next row to display traces of exit point of the same method

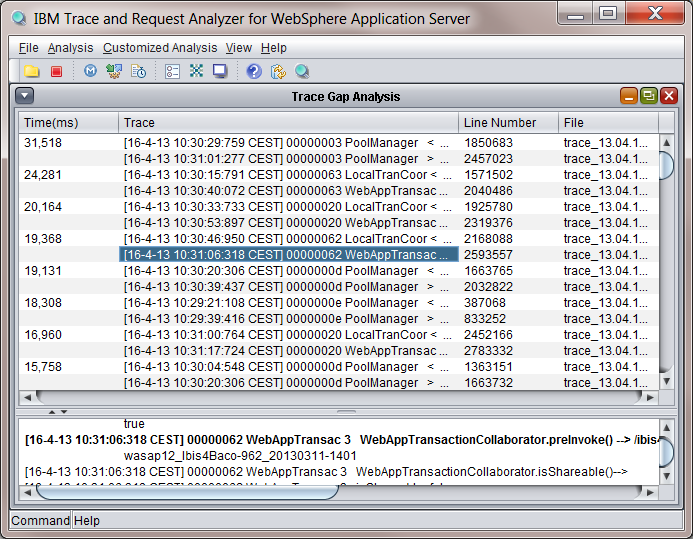
12. By selecting Trace Gap Analysis, you can find gaps of entries regardless of method name.
� Trace Gap Analysis : Sorted list of trace gaps longer than threshold with same thread id
� Time: Time between two trace lines exit of same thread id
� Trace: Actual line from trace file
� Line Number: Line number of the trace entry
� File : File name
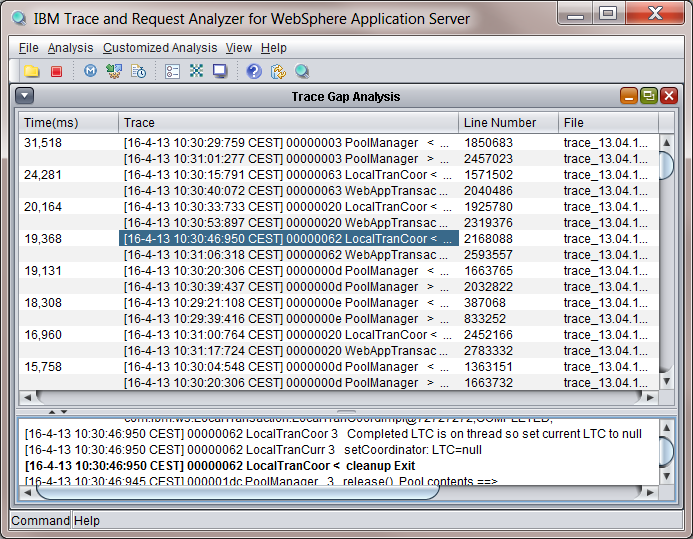
13. Click on each row to display actual trace entries
14. By selecting Request Analysis menu, you can find delays in requests
�
Request Analysis : Sorted list of
requests taken longer than threshold
The following strings are used for detecting requests
- "setRequestURL input ["
- "webcontainer.handleRequest request uri --> "
- "ws_common: websphereHandleRequest: Request is:"
- "SRTServletRes <� finish Exit"
- "ws_common: websphereEndRequest: Ending the request"
� Time: Time between request entry and request completion
� URL: URL of request
�
Status Code : HTTP status code
The following strings are used for detecting requests
- "setStatusCode(sc): set to Status code:"
- "TRACE:��� HTTP/"
� Trace: Actual line from trace file
� Line Number: Line number of the trace entry
� File : File name
15. Select View -> Options to change options
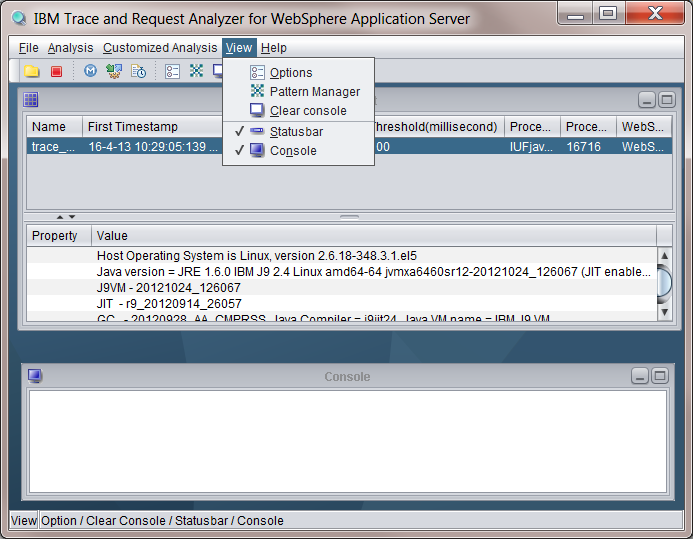
16. On Basic pane the following options can be changed:
� Default directory for opening files
� Gap Threshold. The value 1 means the tool will analyze gaps larger than 1 second
� Number of lines to display : Number of trace entries before and after each line in lower half of the screen as seen at step 15.
� Trace Language : Choose default language
�
Look and feel : User interface configuration

17. Customized gap analysis can be added or modified from Pattern Manager
� Name : Name under Customized Analysis Menu
� Description : description of customized gap search
� Entry Expression : search string for entry
� Exit Expression : search string for exit
� The tool will search for entry and exit keywords to find delays longer than threshold specified in Basic options pane.
� WARNING : Please reopen the file to analyze traces if new keywords are added after traces are already opened and processed.

18. Completed customized analysis will be displayed under Customized Analysis Menu
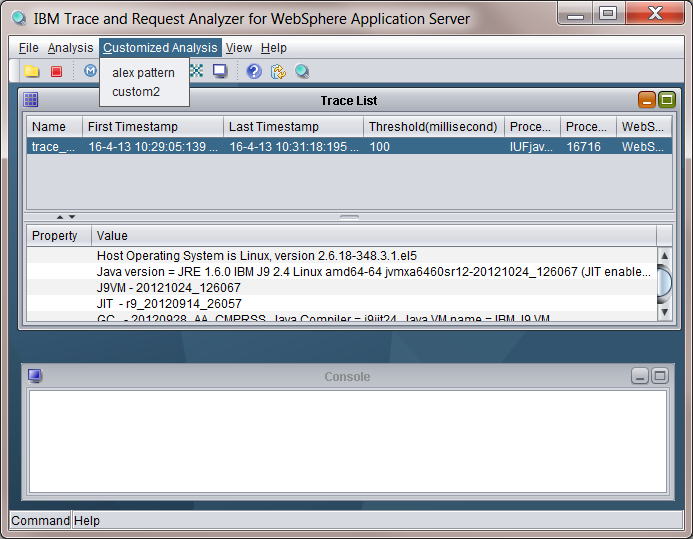
19. Customized Analysis can also be invoked by pop up menu with right mouse
button click
20. Product information can be found by selecting Help->About

Copyrights and Notices
(C) Copyright IBM Corporation 2006-2013. All Rights Reserved. Note to U.S. Government Users Restricted Rights -- Use, duplication or disclosure restricted by GSA ADP Schedule Contract with IBM Corp.
AIX, Cloudscape, DB2, IBM, iSeries, OS/390, WebSphere, and z/OS are trademarks or registered trademarks of IBM Corporation in the United States and/or other countries.
Java and all Java-based trademarks and logos are trademarks of Sun Microsystems, Inc. in the United States and/or other countries.
Microsoft, Windows, and Windows NT are trademarks of Microsoft Corporation in the United States and/or other countries.
UNIX is a registered trademark of The Open Group.
Other company, product, and service names may be trademarks or service marks of others.
The following paragraph does not apply to the United Kingdom or any other country where such provisions are inconsistent with local law:
INTERNATIONAL BUSINESS MACHINES CORPORATION PROVIDES THIS TOOLS "AS IS" WITHOUT WARRANTY OF ANY KIND, EITHER EXPRESS OR IMPLIED, INCLUDING, BUT NOT LIMITED TO, THE IMPLIED WARRANTIES OR CONDITIONS OF NON-INFRINGEMENT, MERCHANTABILITY OR FITNESS FOR A PARTICULAR PURPOSE. Some states do not allow disclaimer of express or implied warranties in certain transactions, therefore, this statement may not apply to you. This information could include technical inaccuracies or typographical errors. Changes are periodically made to the information herein; these changes will be incorporated in new editions of the tool. IBM may make improvements and/or changes in the product(s) and/or the program(s) described in this tools at any time without notices.