Transaction Instance Topology
Transaction instance topologies are displayed for real end-user transactions.
Drill down from the End User Transactions summary through the following
widgets: 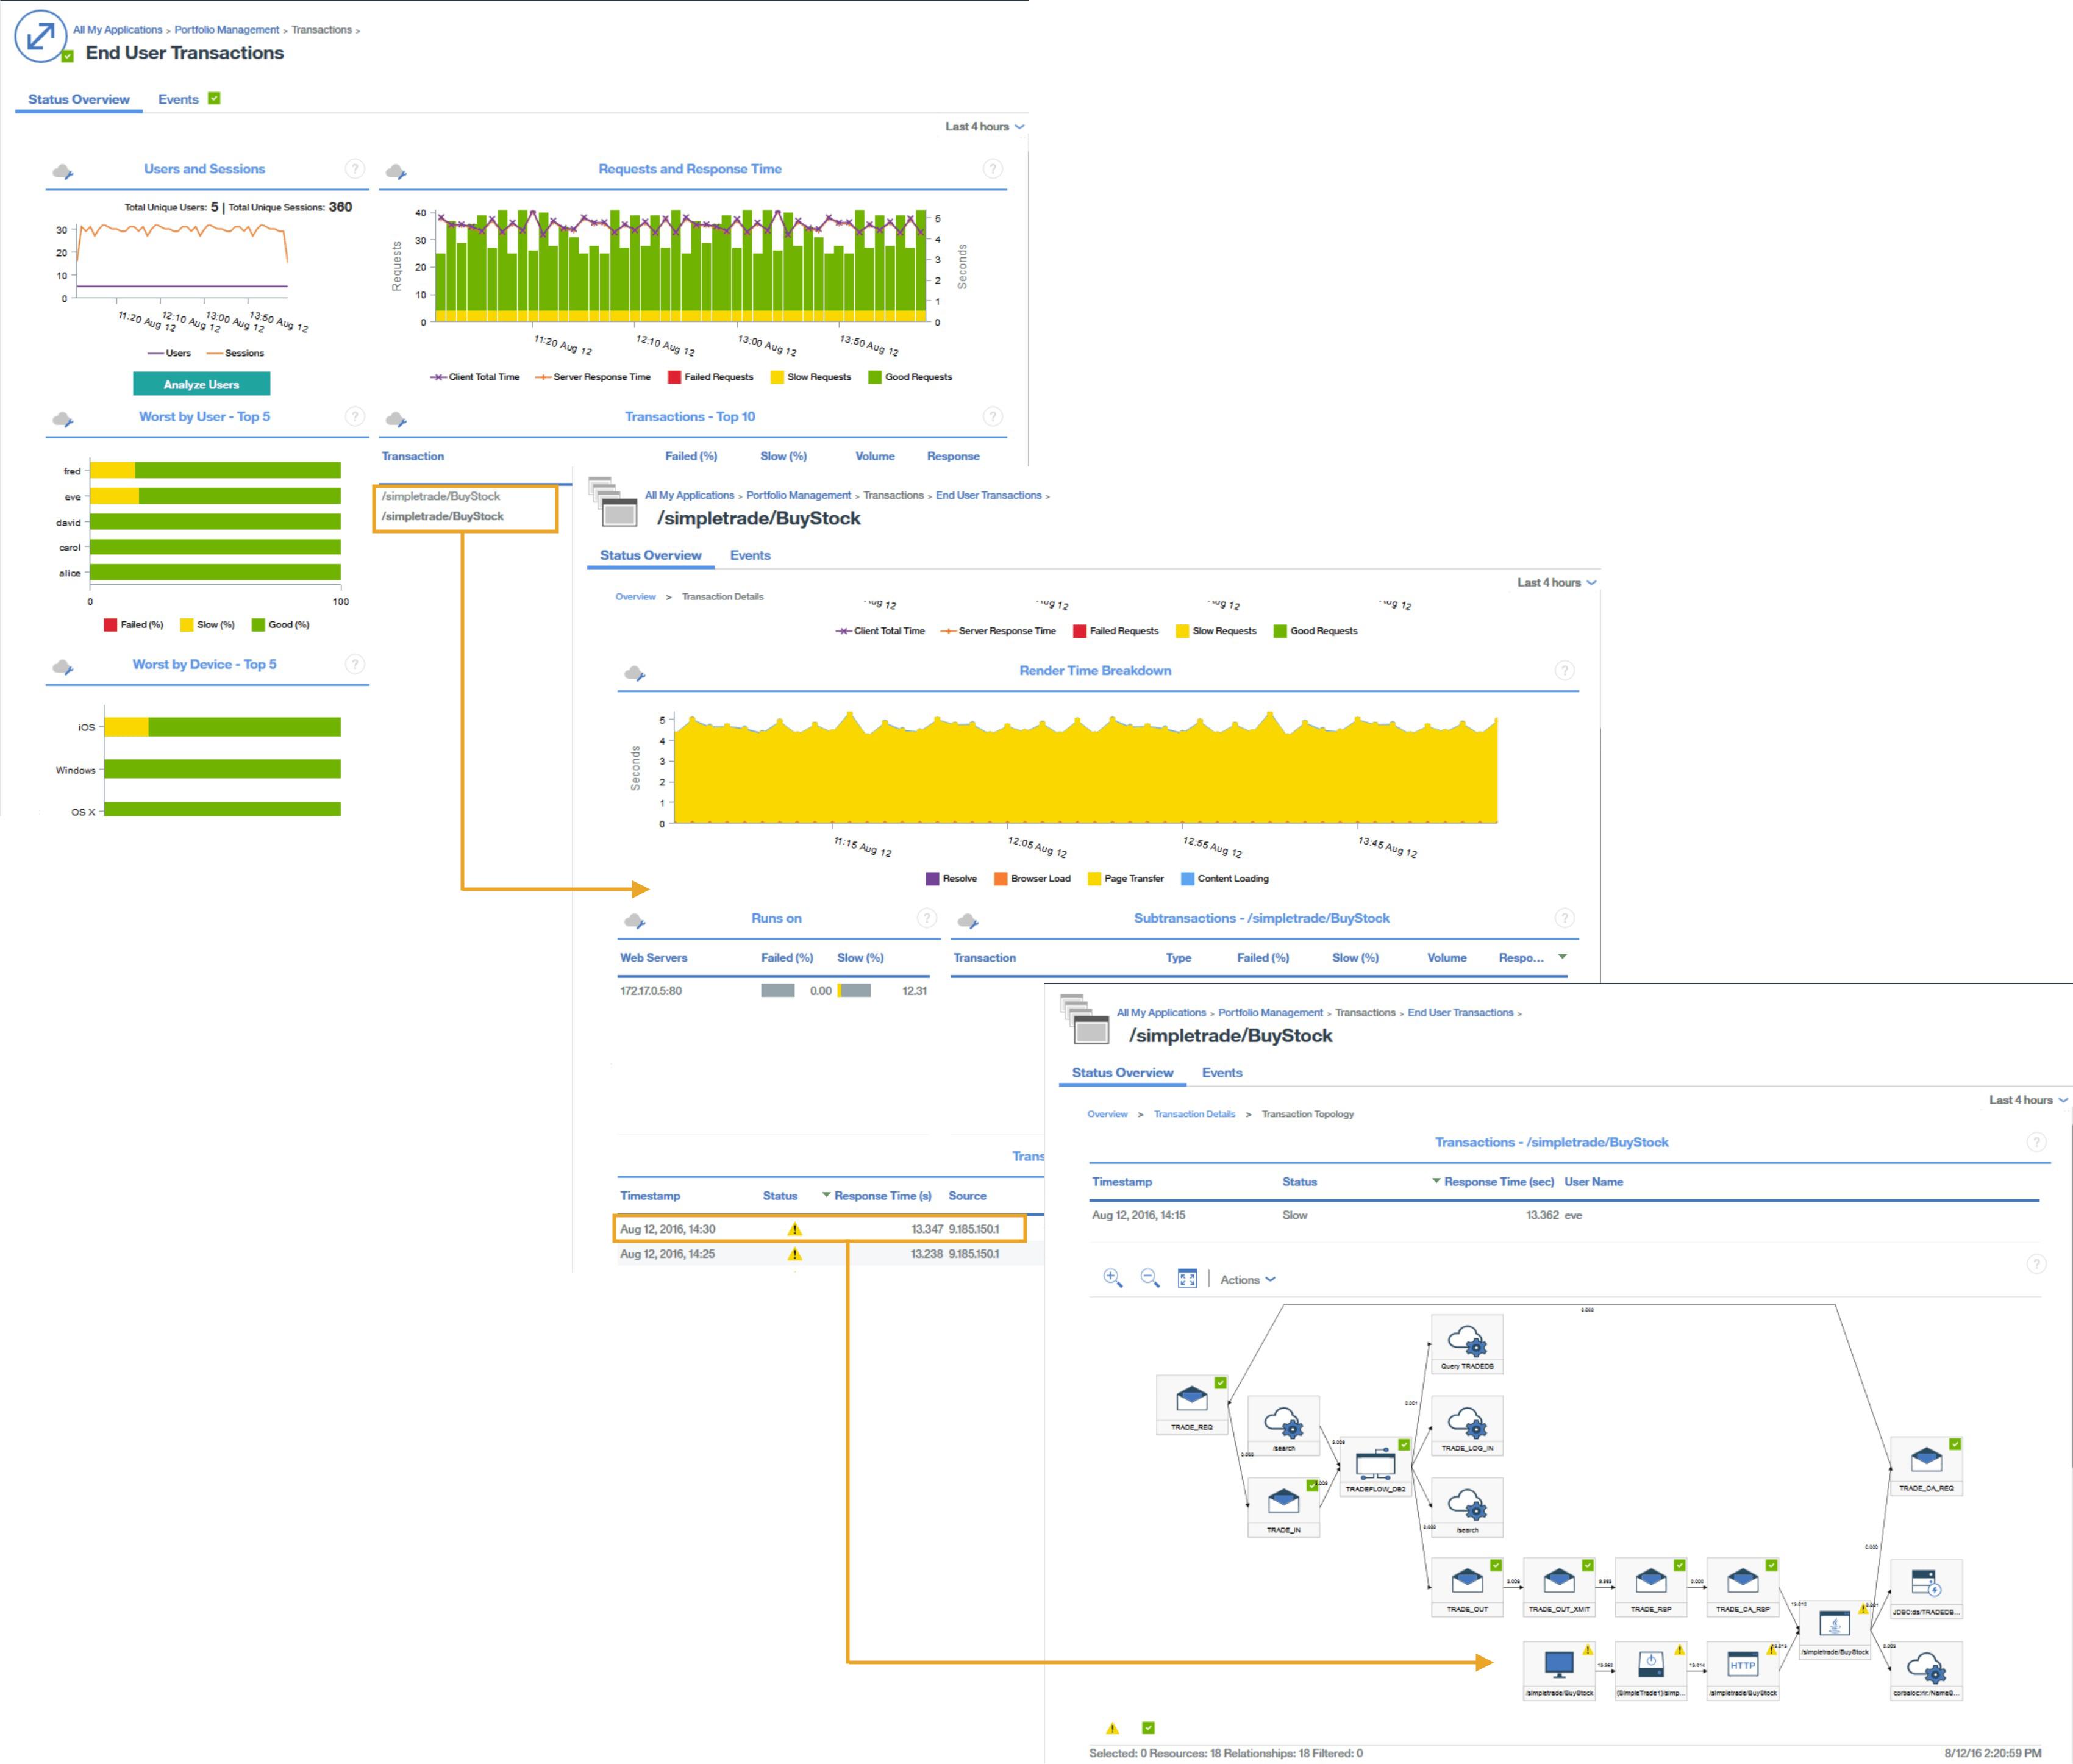
- Select a transaction in the Transactions - Top 10 table
- Select an instance in the Transactions Instances table
Transaction instance topologies for the Java application stack display the following nodes.
Click the node to display information about the node.
- Node for browser-based clients Remember: This node is displayed only when automatic JavaScript injection is measuring data from the browser.
- HTTP nodes, including response times from the browser
- DataPower nodes, if instrumented
- WebSphere Application Server nodes, from which you can drill down to an application resource page
- Database server nodes, from which you can drill down to a database resource status, and SQL
statement diagnostic information for JDBC requestsTip: When the topology indicates that most of the response time is spent in the database, SQL statement information is opened directly when you click Diagnose.
Also displayed are Gantt charts, which summarize instance timings.