Group and Instance - Application Performance Dashboard
Use the dashboard for the selected application group, subgroup, or instance to get a high level status of your managed systems. You can drill down to detailed dashboards with metrics for the selected instance and create custom charts and tables.
The navigator Groups section lists one or more of several possible groups, depending on the constituents of the defined application.
Status Overview
- Groups and subgroups
-
- Select a group or
 expand a group and select a subgroup to see a summary group widget for each managed system
in the application. After you select a subgroup, the summary group widgets in the Status
Overview tab are specific to that subgroup.
expand a group and select a subgroup to see a summary group widget for each managed system
in the application. After you select a subgroup, the summary group widgets in the Status
Overview tab are specific to that subgroup. - The following predefined groups are available, depending on which monitoring products are installed:
 Components
- This group is displayed for all applications, with the exception of the Response Time Monitoring Agent, the Synthetic Playback agent, and Availability Monitoring.
 Transactions
- This group includes End User Transactions and Synthetic
Transactions
subgroups. For more information, see
the help
for Transaction Monitoring and the Synthetic Playback
agent or their reference PDFs on
the IBM Knowledge Center for Monitoring Agent Reference
Guides.Note: The Transactions group is not available for the My Components application.
- After you select Components or a subgroup from the
Groups section, the Status Overview tab changes to show
a summary dashboard with a group widget for each managed resource. The source environment shows as
 Cloud (IBM® Cloud Application Performance Management),
  ITM (IBM
Tivoli® Monitoring),
On Premises (IBM Cloud Application Performance Management, Private) ,
Private Cloud (IBM
Cloud Private), or
ITM (IBM
Tivoli® Monitoring),
On Premises (IBM Cloud Application Performance Management, Private) ,
Private Cloud (IBM
Cloud Private), or  Public Cloud (IBM Cloud). The
Instances section is renamed for the subgroup title and is populated with the
individual instance names.
Public Cloud (IBM Cloud). The
Instances section is renamed for the subgroup title and is populated with the
individual instance names. 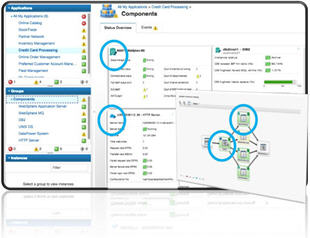
If the application has many managed system instances, many group widgets are displayed. You can scroll through the list to seem them all. You can also select a managed system type from the list of component subgroups, such as Windows OS, to confine the display to the same managed system types. You can also filter the managed system instances.
Firefox browser only: Depending on the number of agents and bandwidth, as you scroll down the Components page, you might see a pop-up message that the script to load the resource page takes a long time to complete. Select the option,
Don't ask me again
to disable the message and continue opening the widgets. Alternatively, you can enter about:config in the address box, search for dom.max_script_run_time and increase the time out value (in seconds). A value of 0 (zero) disables time out.
- Select a group or
- Instances
-
- If many instances are displayed in the navigator, use the search
field
 in the Instances toolbar. As you type, any instances that do not match are removed from the
display.
in the Instances toolbar. As you type, any instances that do not match are removed from the
display. - To pause the Application Performance Dashboard automatic refresh, click
 Pause in the Instances toolbar; to resume automatic refresh, click
  Resume.
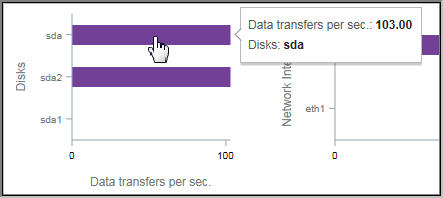
 - If you're viewing a chart with bars missing, it means
that the value is 0 (zero) for that data point.
- If many instances are displayed in the navigator, use the search
field
Events
- The status indicators that are displayed next to the
Events tab title, such as
 14
14  3, show a count of the highest event severities for the selected navigator
item: application, group, subgroup, or instance. Threshold severities are consolidated, as shown in
the following table. For example, Events
means that the highest severity event is minor or warning.
3, show a count of the highest event severities for the selected navigator
item: application, group, subgroup, or instance. Threshold severities are consolidated, as shown in
the following table. For example, Events
means that the highest severity event is minor or warning.
When your managed environment includes IBM Operations Analytics - Predictive Insights and an anomaly is detected, an event is opened. A diamond-shaped icon overlays the status indicator, such asEvents tab Threshold Severity CriticalFatal and Critical WarningMinor and Warning  Normal
Unknown  , to notify you that at least one anomaly has been detected by Operations Analytics - Predictive Insights. For example, Events
 , indicates that the highest status event is Warning and that at least one anomaly event is open.
Custom Views
The pages that you create and save are associated with the selected application. For example, the Inventory Management application in the Cloud APM Guided Demo has the following monitoring agents: Linux® OS, MySQL, Node.js, Hadoop, and Ruby. You can create and save a custom page at any level of the navigator from application to instance and then open it at the same level where it was created. A page that is created at a particular level can be opened only at the same level. The metrics available for the widgets can be from any of the resources in the application. Using the Inventory Management example, you can create a page with a table from the Ruby agent, a chart from Linux OS agent, and so on.
- After you open the Custom Views tab, the Select a Template for your Custom Page window is
displayed or the default page is displayed if it is already set.
- In the Select a Template for your Custom Page window, you can select a template to create a page.
- On the default page, you can click
 to create a new page.
- On the default page, Click
 in the page list and select one of the saved pages from the list.
Attribute Details
- If chart or table pages have been saved for the agent, the most recently opened page is
displayed with metrics from the selected component instance. Click the title
 to select a different saved page from My Pages
 or Shared Pages.