Architecture overview
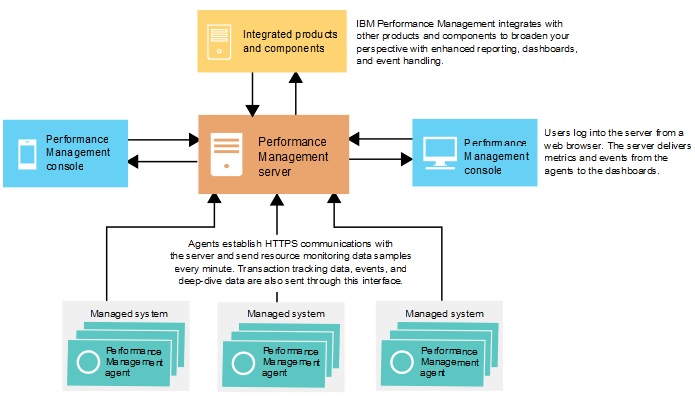
IBM® Performance Management uses agents to collect data on the monitored hosts. Agents pass the data to the Performance Management server, which collates it into the Performance Management console.
Agents
Agents monitor systems, subsystems, or applications and collect data. An agent interacts with a single resource (for example, a system or application) and, in most cases, is on the same computer or virtual machine where the system or application is running. For example, the Linux OS agent collects performance indicators for the operating system on the Linux host and the WebSphere® Applications agent monitors the performance indicators of WebSphere application servers. Also, some agents track transactions between different resources.
You can set up thresholds on key performance indicators (KPIs). If an indicator changes to go over or under the threshold, the agent generates an alert, which the server processes. You can also configure forwarding of events to a target such as the Netcool/OMNIbus Probe for Tivoli® EIF or an SMTP server.
Agents are preconfigured to communicate with the Performance Management server.
Communication between the agents and the server
The agents on every monitored host establish HTTPS communication with the Performance Management server. The agent is the client side of the connection.
Every 60 seconds, agents push information to the server. Every agent pushes all the information that is required to populate the user interface every minute. For example, the operating system agent pushes information such as CPU and memory usage to the server every 60 seconds, even if no user is viewing the information at the moment.
Performance Management server
The Performance Management server receives and processes monitoring information from all agents in your infrastructure. The server also provides the Performance Management console. You can use a web browser to access the console and view the collated information.
When you install the Performance Management server, the installer also deploys a DB2® database and a MongoDB database. You can choose to use an existing DB2 or Mongo database server.
The installer also preconfigures a copy of the agents to communicate with this server. You can use the server to generate a preconfigured copy of the agents later.
Data stored by the server
Every 60 seconds, agents push monitoring data to the Performance Management server. The server stores all the values that are sent by the agents for 8 days. Summarized transaction data is stored for longer periods.
Saved monitoring data is called historical data. The server uses historical data to display tables and graphs that you can use to analyze the trends in your environment.
Historical reports are also available for certain agents.
Scalability
Depending on your IBM Performance Management offering and the capacity of your Performance Management server environment, you can connect up to 4000 agents. For details, see Performance Management server hardware requirements based on system configuration.
Integration
IBM Performance Management integrates with others products and components when they are configured for communications with the Performance Management server.
Products that can be integrated include Netcool/OMNIbus, Tivoli Monitoring, Operations Analytics - Log Analysis, Operations Analytics - Predictive Insights, and Tivoli Common Reporting.
Agent Builder can be used to create custom agents.