When you use a map in a dashboard, you can interact with different map layers to
customize how a map is displayed. You can visualize data by location that uses a heat map layer on a
map. The heat map layer is available as a property on both points and latitude and longitude
layers.
Procedure
-
Click New and then click Dashboard.
-
Leave the default values in the Select a template window and click
OK.
-
In the left pane, click the Visualizations icon
 , and then click the Map icon.
- In the left pane, click Sources, and then click Add a
Source. Select a data source that contains longitude and latitude data.
-
In the visualization, expand and select Longitude/Longitude.
-
In the left pane, expand your data items and drag latitude and longitude data to the
Latitude and Longitude data slots.
-
Drag a measure to the Size data slot.
-
Click the Show properties icon
 ,
and open the Latitude/Longitude layer section.
,
and open the Latitude/Longitude layer section.
- From the Type menu, select
Heat.
- From the Heat weight menu, select one of the next
options:
| Option |
Description |
|---|
| Equal |
The size of the points is equal. |
| By color slot |
The size of the points is controlled by the measurement in the color slot. |
| By size slot |
The size of the points is controlled by the measurement in the size slot. |
- Optionally you can change the heat palette with the Heat pallete
option and change the transparency with the Transparency slider.
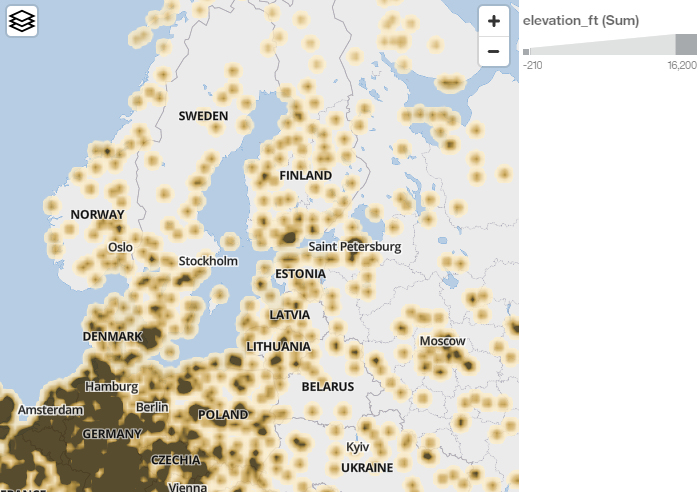
Example
The following example shows latitude / longitude data that is combined with heat as type.
The size of the points resembles the elevation of the locations.