Overview of z/VM capacity planning
- Under-utilize CPUs
- Do not require peak processing at the same time as others
- Have idle times, so that z/VM can share processing cycles with other Linux virtual servers.
Distributed servers running applications being considered for consolidation that run at high utilization throughout the day and peak with other candidate applications are poor candidates for consolidation. In general, the lower the utilization of a candidate application, or the more solitary its peaks are compared to other candidates under consideration, the more likely it can be consolidated.
Likewise, consider a benchmarking strategy that recognizes the real-world characteristics of your Linux workloads. A typical (inappropriate) approach is to conduct atomic measurements that compare throughput of a single instance of an application at a CPU utilization of 100%. This type of benchmarking practice, while simple and easy to conduct, yields inappropriate and misleading expectations of capacity because the practice does not incorporate any of the real-world operational characteristics or highlight any of the elements and advantages of consolidation. While such benchmark comparisons might be appropriate in a distributed paradigm for assessing capacity and performance of stand-alone servers running a single instance of an application, these comparisons are flawed when evaluating z/VM and the mainframe. The flaw is that such comparisons inflate the true operational utilization and throughput of the stand-alone distributed servers and do not account for the ability of z/VM to share idle cycles among virtual servers, which is not possible on under-utilized stand-alone distributed servers. Conducting a benchmark in such a fashion simply answers the question that, if you had one server running one instance of an application at an assumed utilization of 100%, how much throughput can you expect. In a consolidation case, that is not the question to ask. The question when designing a methodology for assessing capacity for consolidation is how many distributed workloads can you fit on z/VM using the true operational utilization and throughput of those workloads you are considering.
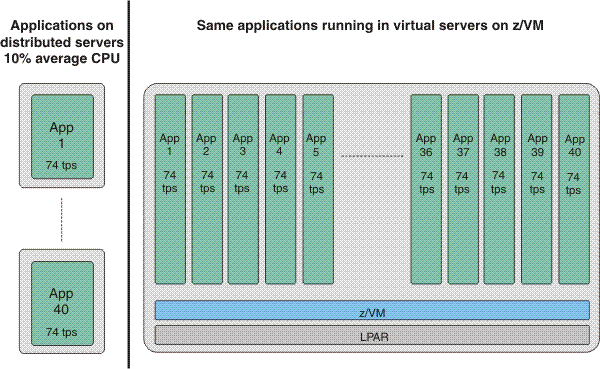
When you have established the baseline of 74 transactions per second for the distributed servers, define an equal number of z/VM virtual servers in which to run the applications.
To assess the system capacity required to support the same volume of work, tune the workload driver so that each instance of the application running in a virtual server produces the same transaction rate as its distributed counterpart.
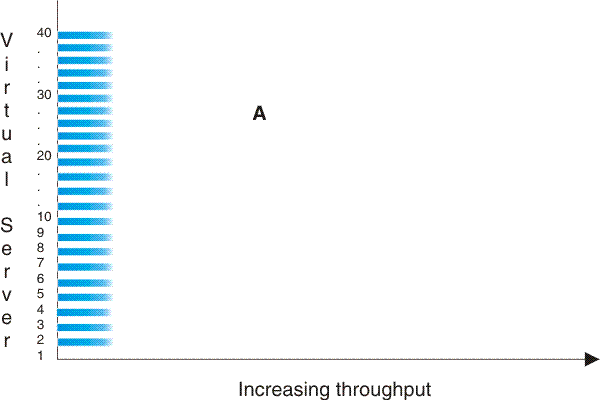
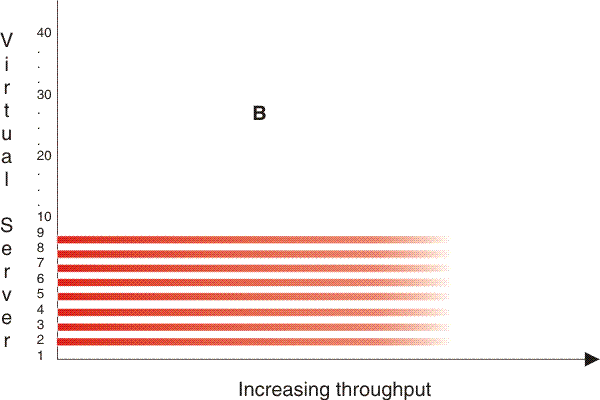
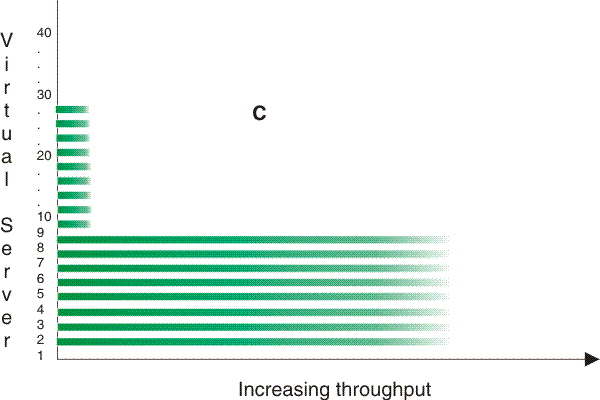
#cbstrat__dqx1wkdist shows three workload distribution patterns. Workload distribution pattern A represents the prior example of an even distribution of work activity among the applications. This pattern shows the worst-case, in which all workloads demand resources at the same time, rather than the characteristics of most production environments. Workload distribution patterns B and C show truer operational characteristics: at any given moment, some applications are busy while others are idle or less busy; and at different times, different applications are busy.
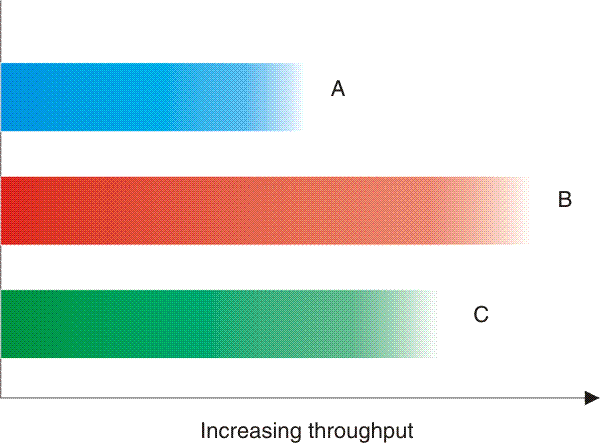
Such distributions reflect the real world and place far less stress on the system because they are more cache-friendly and can result in sharply higher capacity results. Likewise, if your workload has characteristics of a skewed distribution, incorporate this aspect into your benchmarking methodology.