3-D Graphs
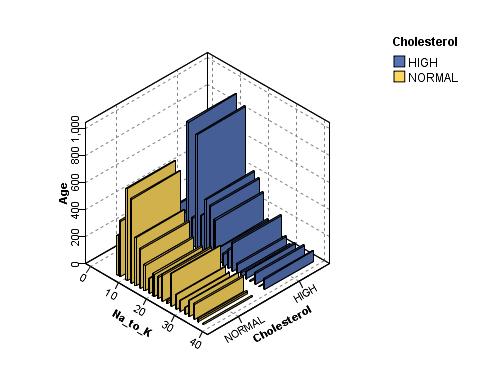
Plots and collection graphs in IBM® SPSS® Modeler have the ability to display information on a third axis. This provides you with additional flexibility in visualizing your data to select subsets or deriving new fields for modeling.
Once you have created a 3-D graph, you can click on it and drag your mouse to rotate it and view it from any angle.

There are two ways of creating 3-D graphs in IBM SPSS Modeler: plotting information on a third axis (true 3-D graphs) and displaying graphs with 3-D effects. Both methods are available for plots and collections.
To Plot Information on a Third Axis
- In the graph node dialog box, click the Plot tab.
- Click the 3-D button to enable options for the z axis.
- Use the Field Chooser button to select a field for the z axis. In some cases, only symbolic fields are allowed here. The Field Chooser will display the appropriate fields.
To Add 3-D Effects to a Graph
- Once you have created a graph, click the Graph tab in the output window.
- Click the 3-D button to switch the view to a three-dimensional graph.