 Monitoring Windows 處理程序
在 Windows 上,當代理程式啟動時, InstanaPCP 應用程式會自動啟動。 InstanaPCP 應用程式會執行下列動作:
- 設定環境以自動追蹤 IIS 管理的應用程式。
- 收集用於執行處理程序 (例如 GC 和 CPU) 的度量值,並將它們傳送至代理程式。
- 將 Windows 主機上執行中處理程序的清單傳送至代理程式。
- 收集
configuration.yaml檔案中定義的自訂效能計數器度量。
自訂效能計數器
Instana 支援監視自訂效能計數器。 依預設會停用自訂效能計數器。 若要啟用自訂效能計數器,請更新 configuration.yaml 檔案,如下列範例所示:
com.instana.plugin.perfcounters:
  enabled: true
效能計數器是以四個不同的值和名稱來定義。 效能計數器依種類分組。 它們可以連結至特定實例或主機層面。 為了唯一說明計數器,使用類似下列範例的語法:
[host]\[category]([instance])\[counter name]
視計數器而定, instance 可能是選用的。 下列計數器是範例:
\Processor Information(_Total)\% Processor Time
下列清單說明範例中計數器的屬性:
host是空的。 計數器適用於現行主機 (localhost)。category是 處理器資訊。instance是 _Total。counter name是 處理器時間百分比。
Instana 僅支援查詢 localhost 計數器。
部分種類僅為主機級; 未針對這些種類定義 instance 。 下列範例顯示整個主機的種類:
\System\Processor Queue Length
啟用旗標之後,請定義您要監視的計數器。 更新配置,如下列範例所示:
com.instana.plugin.perfcounters:
  enabled: true
  counters:
    - category: [name of the counters category]
      instance: [instance name]
      counters:
        - [name of the counter]
下列輸出顯示計數器的範例值:
com.instana.plugin.perfcounters:
  enabled: true
  counters:
    - category: Processor Information
      instance: _Total
      counters:
        - "% Processor Time"
附註: 計數器名稱以雙引號 (") 括住 字元,因為特殊字元 %_
如果每個種類需要更多計數器,請將它們新增至 counters 陣列,如下列範例所示:
com.instana.plugin.perfcounters:
  enabled: true
  counters:
    - category: Memory
      counters:
        - Page Faults/sec
        - Cache Faults/sec
        - Page Reads/sec
附註: 此範例中未定義 instance ,因為 記憶體 種類是全主機。
附註: 查詢效能計數器是一項固有的昂貴作業。 如果您有許多計數器,則會影響代理程式的效能。
下列範例顯示多個種類和計數器:
com.instana.plugin.perfcounters:
  enabled: true
  counters:
    - category: System
      counters:
        - Processor Queue Length
        - System Calls/sec
    - category: Process
      instance: _Total
      counters:
        - Private bytes
        - Working Set
        - Thread Count
    - category: Memory
      counters:
        - Page Faults/sec
        - Cache Faults/sec
        - Page Reads/sec
    - category: .NET CLR Exceptions
      instance: _Global_
      counters:
        - "# of Exceps Thrown / sec"
        - "# of Pinned Objects"
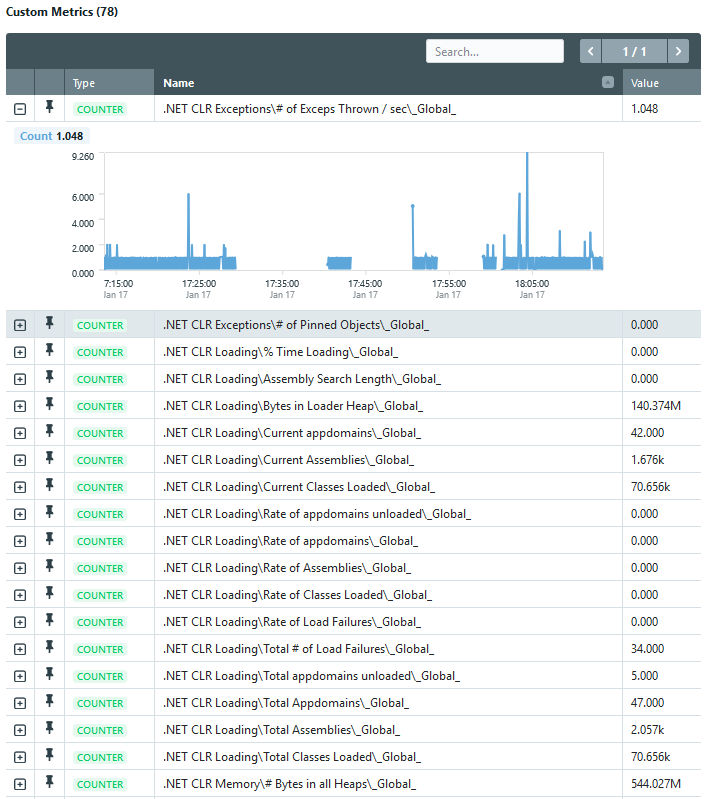
下列範例顯示具有效能計數器的主機儀表板:
如需更多協助,請開立支援案例。