Performance Statistics
The Performance Statistics Report is the key to managing your Sterling B2B Integrator performance.
Before you can generate or view a performance statistics report, you must turn on performance statistics. For more information about how to turn it on, refer to the topic Turning On and Turning Off Performance Statistics. You can turn on and turn off performance statistics as many times as you want to. When performance statistics is turned off, the statistics are simply discarded, and when performance statistics is turned on, the current report resumes the process of collecting statistics. If you do not generate a report before you turn on performance statistics, the default report is generated automatically, and collects the performance statistics.
- Install Sterling B2B Integrator.
- Tune Sterling B2B Integrator using the information provided in the topic Manual Performance Tuning.
- Complete manual tuning, if any, to the install_dir/properties/noapp.properties file and related extension files (*.ext).
- Make improvements to your business processes, if necessary, including changing the persistence levels.
After you receive your initial benchmark Performance Statistics Report, generate a new report every few weeks or at least once a month to have a snapshot of the way your Sterling B2B Integrator is performing in relation to your benchmarks.
If you note variances between your benchmarks and your current report, you can use the information in the report to troubleshoot and resolve issues before they cause performance delays. The most current report is always at the top of the View Report list. After you close a report, no further data can be added to the report. Every time you generate a new report, the new report becomes the current report.
Viewing a Performance Statistics Report
- From the Administration menu, select .
- In the Performance Statistics Report Manager page, under View Report, select a name from the list, and click Go!.
Reading a Performance Statistics Report
Performance Statistics Report provides you with information that can help you maintain your Sterling B2B Integrator system, and reduce performance issues before they become problems. Performance Statistics Report helps you identify and analyze bottlenecks in your business processes and the time taken for the completion of each activity.
The report displays business process statistics and system statistics since the time the report was generated first. If a new report is generated, it does not contain historical statistics, only the statistics collected after it was generated the previous time.
- Business Process Statistics
- Internal System Statistics
Business Process Statistics
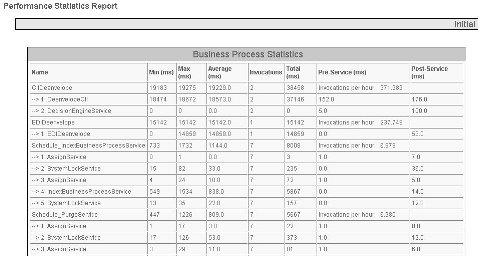
The following figure displays the Business Process Statistics section of a Performance Statistics Report:
| Statistic Name | Description |
|---|---|
Business Process Statistics |
|
| Name | Name of a business process, followed by numbered rows pertaining in the individual activities in the business process. The number of each row indicates the corresponding step in the business process. For example, in the preceding figure, the business
process CIIDeenveloper includes two activities:
|
| Min (ms) | Minimum time (in milliseconds) it took for a business process or activity to complete. If there are multiple invocations, this is the lowest minimum time taken for all the invocations. For example, in the figure preceding this table, it can be seen that the CIIDeenvelope business process took 19183 ms to complete, while the Deenveloping step (1 DeenveloperCII) took a minimum time of 18474 ms. Both these are the lowest statistics; there were two invocations of the business process. Use this statistic to track business processes or activities that begin to slow down. If you notice this statistic increasing over your benchmark value, it may be indicative of a performance issue. If you see an occasional variance for a business process or activity, it does not necessarily indicate a performance issue. If, however, you notice a continuous variance between production statistics and your benchmarks, you probably have a real issue that should be addressed. For more information about slow systems, refer to the topic A Slow System: Symptoms, Causes, and Resolution. For more information about improving business process execution time, refer to the topic Symptoms and Causes of Poor Business Process Execution Time. |
| Max (ms) | Maximum time (in milliseconds) it took for a business process or activity took to complete. If there are multiple invocations, this is the highest maximum time taken for all the invocations. For example, in the figure preceding this table, it can be seen that the CIIDeenvelope business process took 19275 ms to complete, while the Deenveloping step (1 DeenveloperCII) took a maximum time of 18672 ms. Both these are the highest statistics; there were two invocations of the business process. Use this statistic to track business processes or activities that begin to slow down during processing. If you notice this statistic increasing over your benchmark value, it may be indicative of a performance issue. If you see an occasional variance for a business or activity, it does not indicate a performance issue. If, however, you notice a continuous variance between production statistics and your benchmarks, you must resolve the issue. For more information about slow systems, refer to the topic A Slow System: Symptoms, Causes, and Resolution. For more information about improving business process execution time, refer to the topic Symptoms and Causes of Poor Business Process Execution Time. |
| Average (ms) | Average processing time taken for a business process or service to be completed. For example, in the figure preceding this table, it can be seen that the CIIDeenvelope business process took an average of 19229.0 ms to complete, while the Deenveloping step (1 DeenveloperCII) took an average time of 18573.0 ms. Both these are the average statistics; there were two invocations of the business process. Use this statistic to track the overall averages of business processes or activities that begin to slow down during processing. If you notice this statistic increasing over your benchmark value, it may be indicative of a performance issue. If you see an occasional variance for a business or activity, it does not necessarily indicate a performance issue. If, however, you notice a continuous variance between production statistics and your benchmarks, you probably have a real issue that should be addressed. For more information about slow systems, refer to the topic A Slow System: Symptoms, Causes, and Resolution. For more information about improving business process execution time, refer to the topic Symptoms and Causes of Poor Business Process Execution Time. |
| Invocations | Number of times the business process or service was invoked since the report was generated first. The number of invocations should be the same for both the business process and each activity in the business process, unless you have a business process that loops several times. In such a situation, you can set the number of invocations lower than the number of activities in the business process. For example, in the figure preceding this table, it can be seen that the CIIDeenvelope business process had two invocations, and the Deenveloping step (1 DeenveloperCII) had two invocations. Use this statistic to determine if the number of business processes expected are running, and if all the activities in the business processes are running. If you see a variance between the business process invocation number and the activity number, this may indicate that a business process has an error, and is in a waiting, interrupted, or halted state. You can also use this statistic to determine the processing load on your system during different processing periods, such as peak and nonpeak processing hours. |
| Total (ms) | Total time for (in milliseconds) a business process or service has taken to process since the time you last generated the report. This is the sum of total time taken for the completion of all the business processes. For example, in the figure preceding this table, it can be seen that the CIIDeenvelope business process took 38458 ms to process since the report was last generated and the Deenveloping step (1 DeenveloperCII) took a total of 37146 ms. Use this statistic to see if the total processing time for a business process or activity is increasing substantially over the number of invocations. If this number does increase over the number of invocations, it indicates that the processing time is longer. If the processing time is longer than your benchmark, you must resolve the issue. Note: Because
statistics are accumulated from the beginning of monitoring until
its end, you might have to turn monitoring on and off and collect
the statistics at regular intervals. This allows you to monitor performance
at certain times during processing. A change in the total work a business
process performs during the intervals might indicate a problem, but
only if the demand for that business process is constant throughout
the measurement period.
For more information about improving business process execution time, refer to the topic Understanding Business Process. |
| Pre-Service (ms) | Total time taken by the business process engine to complete activities before a business process or service is run. For example, in the figure preceding this table, it can be seen that the DeenvelopeCII activity took 37146 ms for preservice activities. Every time an activity is run, Sterling B2B Integrator must complete system service invocations before running the activity. Use this statistic to see if the system services are taking a long time to run before a business process is run. If you see a variance between the report time and the benchmark time, this may indicate that there is a database, operating system, or some other system issue that must be resolved. For more information about operating system issues, refer to your vendor's documentation. For more information about slow systems, refer to the topic A Slow System: Symptoms, Causes, and Resolution. |
| Post-Service (ms) | Total time taken by the business process engine to complete activities after the business process or service is run. For example, in the figure preceding this table, it can be seen that the DecisionEngineService activity took 100 ms for postservice activities. Every time an activity runs, Sterling B2B Integrator completes some persistence of information to the database. This persistence takes time to complete, and the postservice time includes this persistence time. Use this statistic to see if the system services are taking a long time to run after a business process is run. If you see a variance between the report time and the benchmark time, this may indicate that there is a database, operating system, or some other system issue that must be resolved. For more information about operating system issues, refer to your vendor's documentation. For more information about slow systems, refer to the topic A Slow System: Symptoms, Causes, and Resolution. |
Internal System Statistics
The Internal System Statistics section of the Performance Statistics Report includes a lot of information that you can use to monitor your Sterling B2B Integrator system and ensure that it meets the benchmarks that you have established.
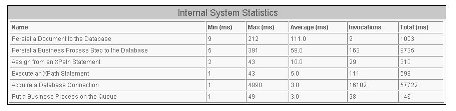
The following figure displays the Internal System Statistics section of a Performance Statistics Report:
| Statistic Name | Description |
|---|---|
Internal System Statistics |
|
| Name | Name of the system activity, including the
following:
|
| Min (ms) | Minimum time (in milliseconds) the system activity took to complete. If there are multiple invocations, this is the lowest time for all the invocations. For example, in the figure preceding this table, the Persist a Document to the Database activity took 9 ms to complete. This is the shortest time of the nine invocations of the activity. |
| Max (ms) | Maximum time (in milliseconds) the system activity took to complete. If there are multiple invocations, this is the highest time for all the invocations. For example, in the figure preceding this table, the Persist a Document to the Database activity took 212 ms to complete. This is the longest time of the nine invocations of the activity. |
| Average (ms) | Average processing time taken for the system activity to complete. This is the average time for all invocations. For example, in the figure preceding this table, the Persist a Document to the Database activity took an average of 111 ms to complete. This is the average processing time taken by the nine invocations of the activity. |
| Invocations | Number of times the system activity was invoked since you last generated the report. For example, in the figure preceding this table, the Persist a Document to the Database activity was invoked nine times. |
| Total (ms) | Total time (in milliseconds) the system activity has taken to process since the report generation began. This is the sum total time of all the system activity completion times. For example, in the figure preceding this table, the Persist a Document to the Database activity took a total of 1003 ms to complete. |
| Statistic Name | Description |
|---|---|
| Persist a Document to the Database | The length of time and the number of times a document was persisted to the database. For more information about persistence, refer to the topic Changing Persistence Levels. For example, in the figure preceding
this table, Persist a Document to the Database had the following
statistics:
The Persist a Document to the Database statistic is helpful
in determining database issues and slow processing issues. When you
compare this information with your benchmarks, verify if you notice
the following:
|
| Persist a Business Process Step to the Database | The length of time and the number of times a business process step was persisted to the database. For more information about persistence, refer to the topic Changing Persistence Levels. For example, in the figure preceding
this table, Persist a Business Process Step to the Database had the
following statistics:
The Persist a Business Process Step to the Database
statistic is helpful in determining database issues and slow processing
issues. When you compare this information with your benchmarks, verify
if you notice the following:
|
| Assign from an XPath Statement | The length of time and the number of times an assign activity was completed from an XPath statement in a business process. For example, in the figure preceding this table,
Assign from an XPath Statement had the following statistics:
The Assign from an XPath Statement statistic is helpful
in determining if you have well-structured XPath statements in your
business processes. When you compare this information with your benchmarks,
verify if you notice the following:
|
| Execute an XPath Statement | The length of time and the number of times an XPath statement ran in a business process. For example,
in the figure preceding this table, Assign from an XPath Statement
had the following statistics:
This statistic is helpful in determining if you have
well-structured XPath statements in your business processes. When
you compare this information with your benchmarks, verify if you notice
the following:
|
| Acquire a Database Connection | The length of time and the number of times a database connection was made. For example, in the figure
preceding this table, Acquire a Database Connection had the following
statistics:
The Acquire a Database Connection statistic is helpful
in determining whether you have database issues, resource leaks, or
whether you have to increase the number of database pools. When you
compare this information with your benchmarks, verify if you notice
the following:
|
| Put a Business Process on the Queue | The length of time and the number of times a business process was placed in a queue. For example, in
the figure preceding this table, Put a Business Process on the Queue
had the following statistics:
The Put a Business Process on the Queue statistic is helpful in determining if you are using a queue instead of your cache during processing. When you compare this information with your benchmarks, verify if you notice increasing invocation times. If yes, it indicates that you are not using your cache efficiently. |