RHEL 4.5 Trade tuning variations
The purpose of these test runs was to adjust different tuning parameters and to measure how the throughput was affected.
We applied the appropriate tuning parameters for each test. After comparing our measurements with different tuning variations, we found the optimum operating parameters for the Trade workload in our test environment and developed best practices recommendations.
Disk tuning variation: impact of 2105 - F20 disk latencies
Test case description
These tests were performed to evaluate how the latencies from our physical disk devices affected the Trade results. To show what happens in an environment with very low disk latencies, we used a RAM disk for the database files. This test was performed to determine if our disk configuration was a performance bottleneck. Other than the RAM disk used as a disk for the database files, the Trade test setup was identical to all our other test runs. The database was on Linux on System z. For more information on our disk setup see Configuring the xpram device on RHEL
| WebSphere Application Server | Trade Results | DB2 Database | ||||||
|---|---|---|---|---|---|---|---|---|
| Distro | Disk | #CPU | %CPU | #Users | Resp | %ETR | #CPU | %CPU |
| RHEL 4.5 | RAM | 8 | 83.79 | 20 | 7 ms | 100 | 4 | 62.45 |
| RHEL 4.5 | RAM | 8 | 92.96 | 40 | 12 ms | 113 | 4 | 73.68 |
| RHEL 4.5 | RAM | 8 | 93.77 | 60 | 18 ms | 113 | 4 | 74.87 |
| RHEL 4.5 | RAM | 8 | 93.15 | 80 | 25 ms | 112 | 4 | 75.41 |
| RHEL 4.5 | F20 | 8 | 91.61 | 60 | 18 ms | 111 | 4 | 77.48 |
Observations
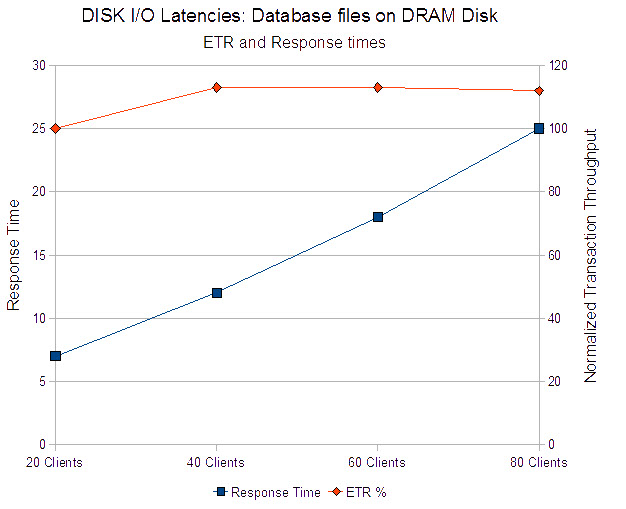
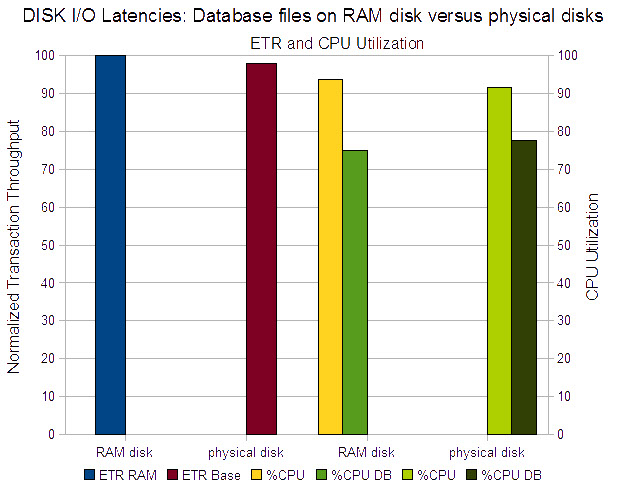
Figure 1 shows throughput and latency characteristics as the number of workload generating clients (trade users) is increased to raise the load. With 80 clients the test configuration is over driven and throughput decreases. The load on the system should always be monitored so that this condition does not occur as throughput is degraded. Figure 5 shows that our results with 60 Trade users using a RAM disk for the database files is very similar to the runs with the physical F20 ESS disk run. The ETR was 2% higher using a RAM disk and the WebSphere Application Server CPU utilization was 2.4% greater. However, the test done with the RAM disk did show slightly less database CPU consumption, 3.5% less than the runs with physical disks. The response times were equal for both runs, 22 ms.
The response time increases in a linear manner when we add users. 60 users give us the most throughput, while 80 users overdrives our test setup and reduces throughput. Going from 40 to 60 users increases throughput very slightly, about 1%, but latency increases 50%.
Conclusion
The results with the database files on a RAM disk are similar to runs using only F20 disk devices. This shows that, in our environment, the configuration of the disk I/O subsystem is not a performance bottleneck. Verifying this fact was the only purpose of this test. Our results confirm that the change from the 2105–F20 to 2105 800 has no significant impact on our results.
Tuning variation: Linux® network settings
Test case description
Linux network settings were changed to evaluate the impact on throughput. We changed the buffer_count setting for all involved network connections (the private OSA device and the HiperSockets on both WebSphere Application Server and DB2). For information on how to change your buffer settings see Changing buffer settings of the network interfaces.
We ran the Trade workload in our 3 tier environment using RHEL 4.5 and also used the RHEL 4.5 database on Linux. We then compared the output of the run that used the buffer count of 128 to the base run with the default buffer count of 16.
| WebSphere Application Server | Trade Results | DB2 Database | ||||||
|---|---|---|---|---|---|---|---|---|
| Distro | Buffer count | #CPU | %CPU | #Users | Resp | %ETR | #CPU | %CPU |
| RHEL 4.5 | 128 | 8 | 92.54 | 60 | 18 ms | 100.0 | 4 | 78.56 |
| RHEL 4.5 | 16 (default) | 8 | 91.61 | 60 | 18 ms | 97.5 | 4 | 77.48 |
Observations
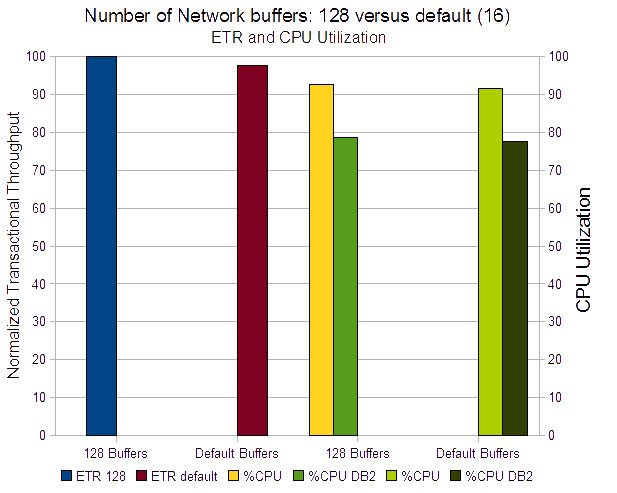
Figure 3 shows that our results from the 60 user run, with a buffer count of 128, is very close to that of our 60 user run with a buffer count of 16. The transaction throughput with the highest number of buffers was 2.5% higher and the WebSphere Application Server percent CPU consumption was 1% greater than with the default of 16. This gave us nearly identical ITRs for the two runs. The run with 128 buffers also consumes 1.4% more CPU on the DB2 LPAR.
Conclusion
The higher number of buffers for the network interface to the database provides a slightly higher transactional throughput. Transferring the effort for checksumming to the network interface has only an impact on the OSA card, and no impact on a HiperSockets interface. Because HiperSockets is a virtual network interface using memory to memory transfers in place of packets on a LAN interface, it does not provide the required hardware to realize checksumming offload.