I/O tracing using blktrace
The Linux kernel can collect events about all state changes of I/O requests. Later, the blktrace utilities can derive data from these events.
Before you begin
I/O tracing with blktrace requires two parts:
- A Linux® kernel with the config option CONFIG_BLK_DEV_IO_TRACE enabled.
- The blktrace userspace utilities, available from:
orgit://git.kernel.dk/blktrace.git
The blktrace README file tells you where to get the sources, how to use blktrace and where to find the documentation.http://brick.kernel.dk/snaps/
About this task
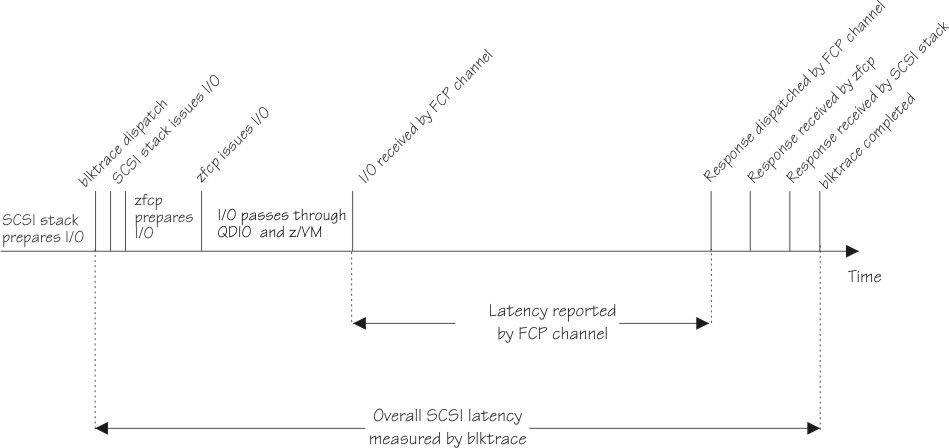
You can collect data about I/O requests with the help of blktrace (see Figure 1).
Hint: While the I/O analysis can be run at
the system where I/O is actually being traced, two Linux systems
should be used: One that is being traced and the trace data is being
redirected through a network connection to the second one for evaluation.
This minimizes the impact on the system being traced.