Group by sections
A Group By section shows data in a tabular grid-like format grouped by the values of a specified field.

The data in a Group By section is sourced from a query. The platform takes sorted records from a query and displays them in a tabular format, showing data grouped by the values of one specific field. The format shows more than one field for the record in the grouped by section and allows dynamic runtime properties (Visible, Read-Only, and Label) for these columns.
This section type allows a lot of data to be shown in a small amount of real
estate in a cross tab-like format. It condenses data, taking all records with like column
values and displaying them in a grid.
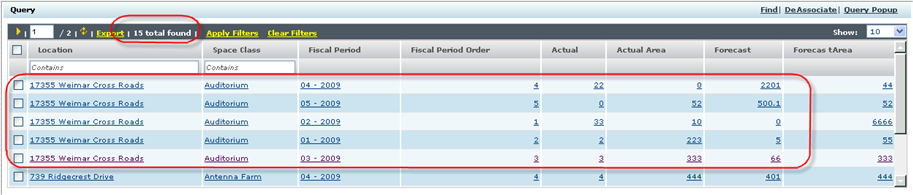
Fields in a group by section can be edited. A border indicates to the user which fields can be edited. The platform can save the changes.

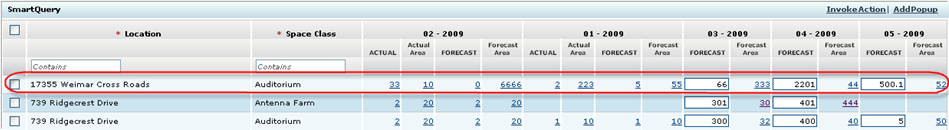
- Group By Field
- Field whose values the section will be grouped by. There should be a discrete number of values for this field as its values determine the number of columns in the section. This is Period is indicated by A in figure 4.
- Group By Columns
- Fields to show in the Group By section. These are the fields that show for each record in the row/column. This is B in figure 4, and the fields are: Actual, Actual Area, Forecast, and Forecast Area. Notice not all are visible for each Group By field value. In this example, the system uses runtime metadata to hide/show based on the Group By Field value.
- Columns
- These fields determine the contents of the row. All records with like valued columns make up a row. This is C in figure 4, and the fields are Location and Space Class. Raw data is sorted first on Location, then on Space Class. All records with the same Location/Space Class combination make up a row.
Each group of cells under a Group By Field value represents a record.