Calc Explorer
Overview
Calc Explorer enables administrators to gain insights into the calculation processes and analyze the performance of lengthy builds. It lays the groundwork for future enhancements in configuration and performance analytics. The Calc Explorer only captures items which take longer than 10 seconds to calculate. As an example, you may navigate to a report, and then to a period within the report, but find no components listed. This is because for that build, report, and time period no report components took more than 10 seconds to calculate. The Calc Explorer also shows builds specific to Trunk or a branch, separately. The user can switch between Trunk and any active Branch to view the desired builds instead of scrolling through the huge list. The “carat” will be displayed only if there are multiple calculations of the same build.
As of version 12.11.4, Calc Explorer is available to all administrators by default (GA).
Navigation
To access Calc Explorer, navigate to the Build tab on the TBM Studio Ribbon and select Calc Explorer.
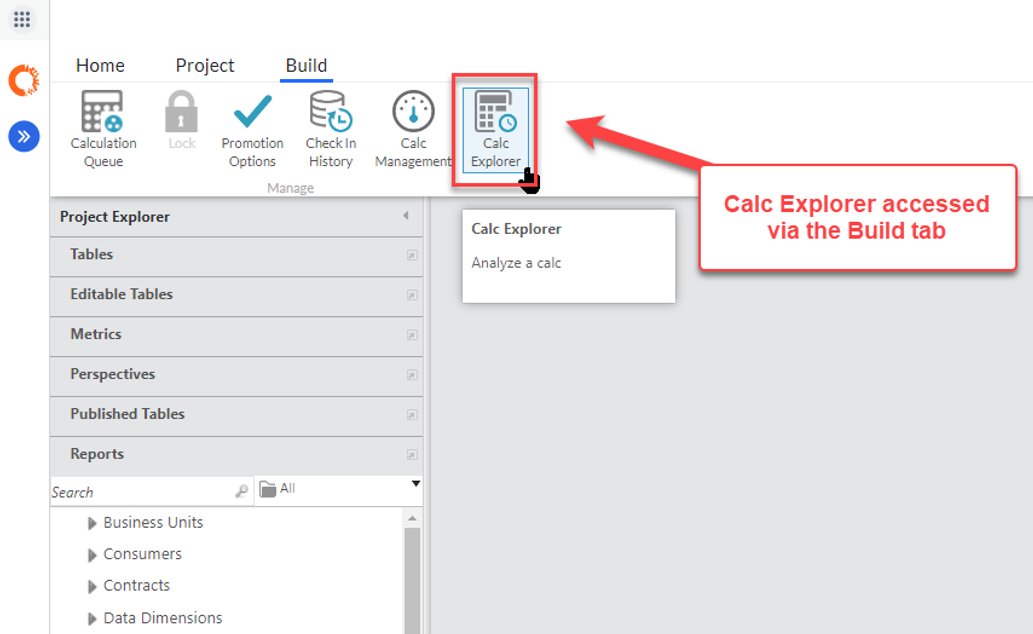
This opens a new document displaying a list of builds for analysis.

Definitions
| Field | Description |
|---|---|
| Build | A specific point in the progression of Check Ins that can be calculated for display in Flagship. |
| Calc | A calculation of a specific build. |
| Entity | A component of a project (e.g. Transforms, Metrics, Reports). |
| Calc Type |
A description of the number of entities calculated compared to the entire project.
|
| Query | The smallest unit of a calc, typically an entity for a specific time period. |
| Build Duration | Time taken by the build - in hh:mm:ss and in mins. You can search for the biggest or shortest build by specifying the range, like <5, >70, and so on. |
| Max Timeperiods | Shows the maximum number of time periods for the build. |
| Number of Queries | Shows all the queries in a build, in table form. You can search and sort for particular entities. The list of calculated time periods can also be brought up. |
| Change Set | What project changes were made since the previous build. |
| Changes | What Check Ins have been made since the previous build. |
| Calculation Effort | A measure of the resources needed to complete a particular query, expressed as a number. Example, 3.2M instead of 3,200,000. |
| Transform | A Table with all of its associate transform steps typically based off a raw data source. |
| Number of Columns | The number of columns in the output step of a Transform. Example, 2.50L instead of 2,50,000. |
| Number of Rows | The number of rows in the output step of a Transform. Example, 2.50L instead of 2,50,000. |
| Report | Report that contains a collection of KPIs, graphs, charts, and tables. |
| Report Component | A single KPI, graph, chart or table that is part of report. |
Interaction
Clicking on a build in Calc Explorer displays a summary of the build, including various entities based on the scope of the calculation.
Partial Build
Displays entities relevant to the partial calculation.

All build
Features a Sankey diagram starting at Level 1, showing entities sized and sorted by Calculation Effort. Drill down into each entity for detailed calculation components and entity specifics.

Sankey Navigation
Reports
Click on the Report entity to drill to the first level of information where the top 10 reports are shown, with the remaining reports consolidated into a single flow. The size of each flow is based on the calculation effort and is sorted in descending order. Hovering over a report name displays the Calculation Effort for that specific report, including % of Total and % of Parent.

Right-click on the report to either open the document (for the selected period) or see the full data path.

Filter for specific reports by name by entering a search term in the Search Last Tier box. Navigate through the full list of reports by using the left/right arrows around the Showing 1-10 of X paging feature located below the Search box.

The second level drill shows the top ten time periods by Calc Effort, with the rest consolidated into a single flow. Here again, you can right-click on the time period to either open the document or see the full data path.

The third level drill displays the report components that are the most calc-intensive. By hovering over the component, you'll reveal detailed insights into its consumption of maximum calculation time, both in relation to its parent report and the aggregate time across all entities.

- Right-click on the report component in Calc Explorer.
- Select "show document".
- When the report opens the report component should be outlined in blue:

Transforms
Clicking on Transforms will take you out of the previous entity you were viewing, and display the first level of transforms with the default sort by Calculation Effort.

- The value in the first dropdown determines the thickness of lines and boxes
- The value in the blue bar dropdown determines the height of blue bars
- The value in the red bar dropdown determines the height of red bars
Only Transforms have the Rows and Columns attributes, as shown:


Right-click on the transform time period to either open the document or see the full data path.
Drills and Metrics
Drills and Metrics work similarly to Reports and Transforms.

- Total Matrix Rows - Total number of rows in the calculated matrix
- Total Matrix Columns - Total number of columns in the calculated matrix
- Assignment Ratio Rows - Count of rows containing actual allocation values (excludes empty/zero rows)
- Matrix Type - Indicates whether the matrix is dense (high percentage of non-zero values) or sparse (mostly zero/empty values)

