Anomaly Detection
Anomaly detection in Cloudability helps organizations identify unusual or unexpected patterns in cost spending. This cloud-agnostic feature provides a comprehensive analysis across all services to detect cost anomalies, enabling users to mitigate sudden billing spikes through timely alerts. Users can monitor anomalies directly within Cloudability or receive notifications via email and Pager Duty.
Key capabilities
- Detect anomalies in cost data across your cloud environments
- Configure alerts using absolute (currency) and percentage thresholds
- Drill into anomaly details and export or create tickets (Jira, ServiceNow)
- Create tickets in Jira or ServiceNow directly from within Cloudability
- Access anomalies programmatically via REST API
How Anomaly Detection works
Cost Segment Formations
Cost Segment Formation is the process of breaking down total cloud costs into smaller segments based on service type, account, usage category, and the most relevant tags and business mappings. This helps the system identify unique cost patterns and detect anomalies more accurately.
There are two types of Cost Segments:
Service-Level Cost Segment and Configurable Cost Segment
Service-level Cost Segment formation is calculated using the total costs by date, service name and usage family.
.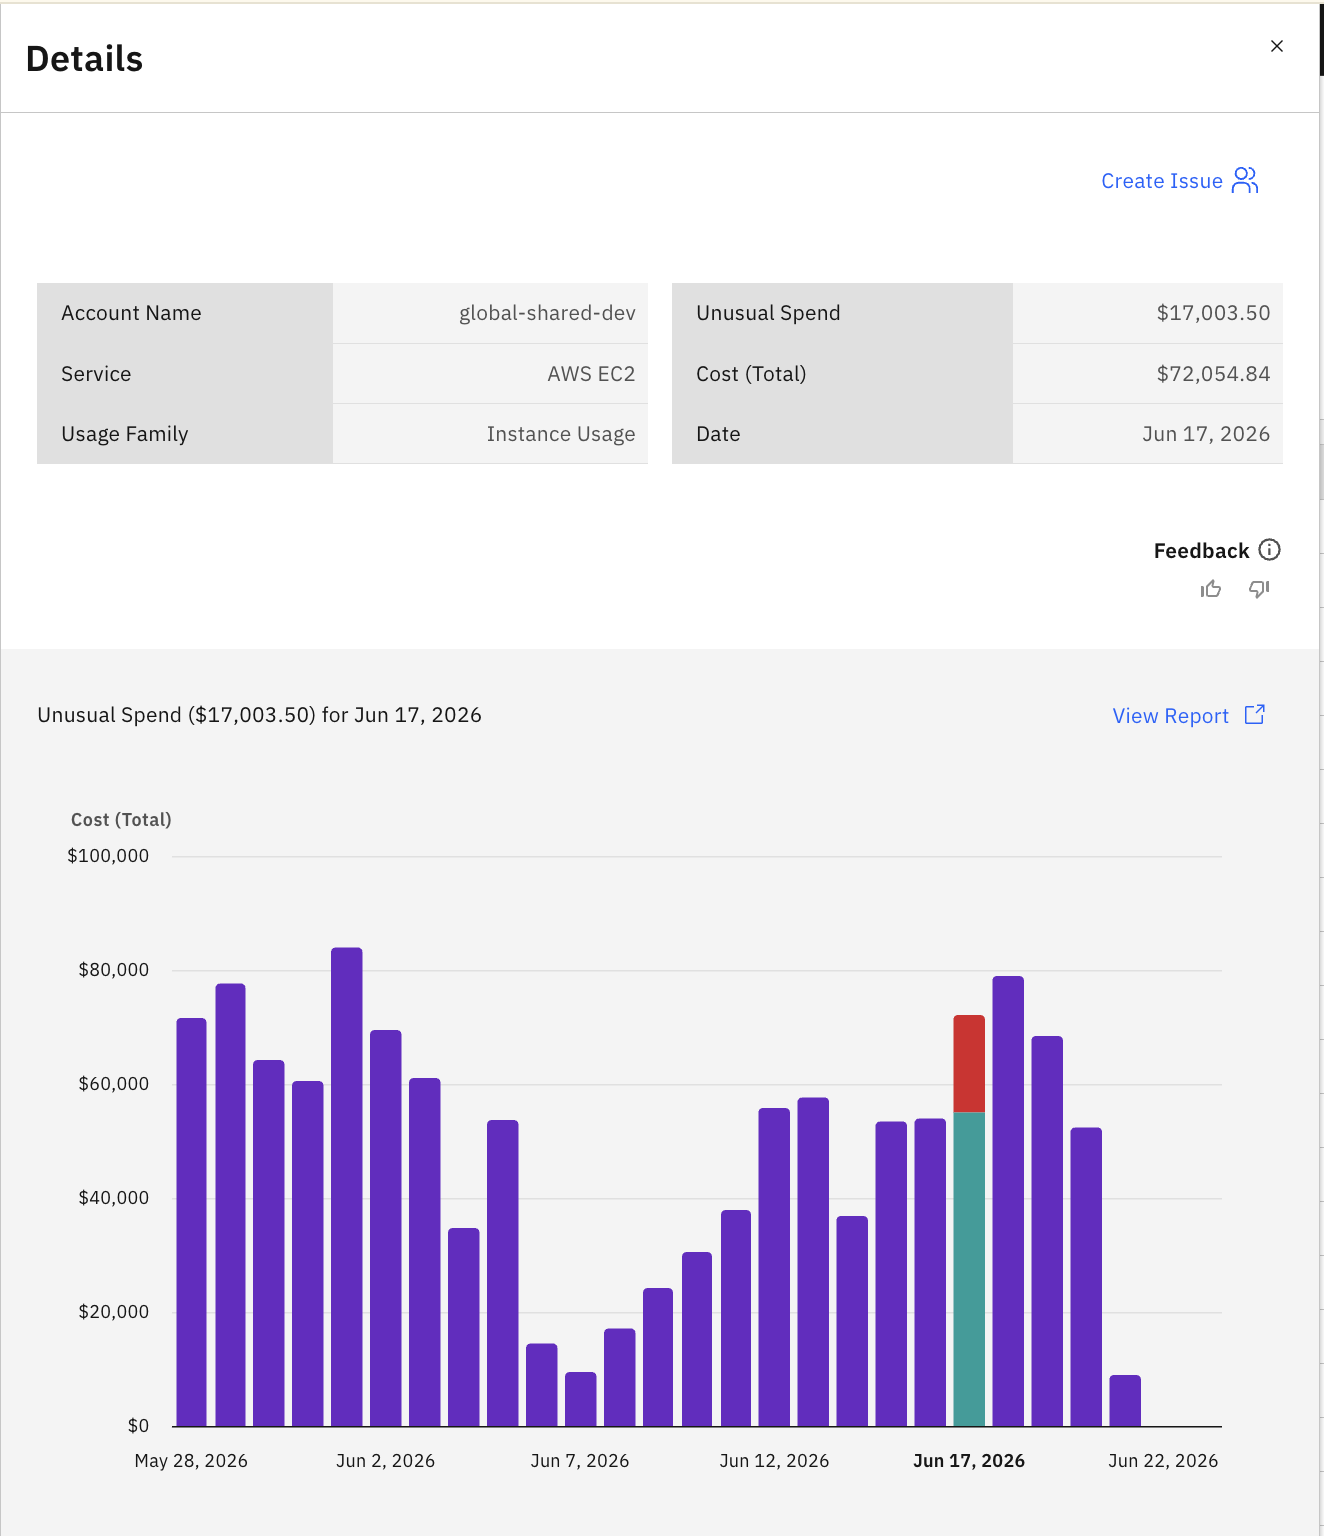
The tags and mapping dimensions are not used for the calculation so the Details page does not display tags and business dimensions.
Configurable Cost Segment is calculated using the total costs aggregated by date, service name, usage family, account, and up to 4 Tags and Business Mapping dimensions selected by the Cloudability Admin.
Below is an example where we have defined the tags, and the Business Mapping algorithm is chosen for identifying anomalies.
 The tags and mapping dimensions are used for the calculation so the Details page
display tags and business dimensions.
The tags and mapping dimensions are used for the calculation so the Details page
display tags and business dimensions.
- Only Cloudability Admins can select up to 4 dimensions in total from Tags and Business Mapping dimensions.
- These selected dimensions are used to form cost segments for anomaly detection.
Tag and Business Mapping Dimensions Selection
- Navigate to the Anomalies page in IBM Cloudability.
- Click Anomaly Settings in the top action bar.
- This opens the Adjust Anomaly Detection panel.
- Select a Tag or Business Mapping dimension from the dropdown and click Add.
- Repeat this step to add up to 4 Tag and/or Business Mapping dimensions.
- Click Save to apply the configuration.
- Changes may take up to 24 hours to take effect.
Setting Up an Alert
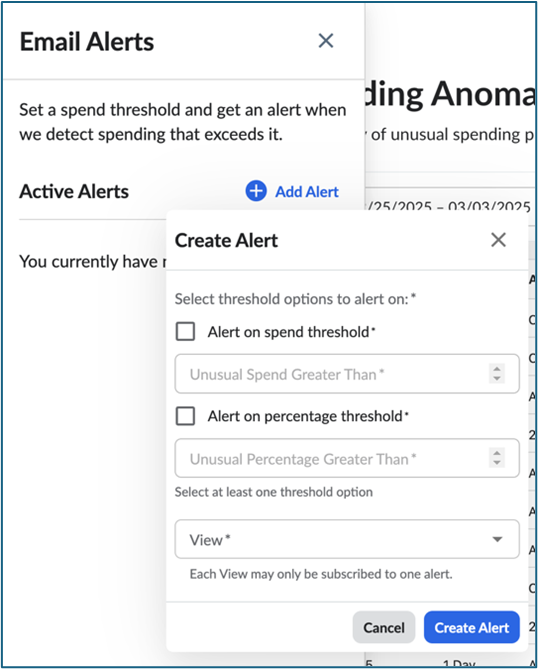
To set up an alert, first define and identify the situation you want to monitor.
Within the alert window, users need to complete two sections:
- Select a View – Specify the view for which you want to receive an alert.
- Set a Threshold – Choose a threshold value, either as an absolute number OR a percentage.
What is a View in Cloudability?
A View in Cloudability is a powerful data-filtering tool that helps organizations customize and control how cloud spend and usage information is displayed and shared. Views let you build app-wide filters for your data and assign them to different users based on organizational needs.
For more details, see Setting Views in Cloudability.
After the view is set up, create an alert in the Anomaly Detection section of Cloudabilty. Consider the following example.
A user wants to monitor cloud spending for their cloud account using Cloudability. They set up an alert for a selected View with the following thresholds:
- Absolute Value Threshold: $50,000
- Percentage-Based Threshold: 20% unusual percentage (calculated from expected spend).
Formula for unusual percentage:
- Where:
Now consider the scenarios:
Scenario 1: Unusual Spend Threshold Triggered
Scenario 2: Unusual Percentage Threshold Triggered
If your expected spend is $40,000 and your alert threshold is set to 20% unusual percentage, then according to the Unusual Percentage formula, if the unusual spend is $8,000 or more, the alert will be triggered.
This is because:
You also have the flexibility to choose either one of the threshold values or both values.
Accessing Anomaly details
To explore an anomaly in more detail, click the View Report button on the detail page. This will open the reporting interface, where you can add additional dimensions or adjust the date range for deeper analysis.
To access anomaly details, follow the steps below.
- Navigate to Insights > Anomaly Detection.
- On the Spending Anomalies page, click Details.
- Select View Report to add more dimensions for analysis.
- Use the Edit option to modify the time period or date range for a customized view.
This provides a comprehensive investigation of cost anomalies helping you gain better insights into unusual spending patterns.
Creating Jira or ServiceNow Tickets for Anomalies
You can create tickets in your IT Service Management (ITSM) tools like Jira Cloud and ServiceNow directly from for each anomaly showed on the Anomaly page. This enables you to initiate investigations on identified anomalies without leaving Cloudability. Both integrations include bi-directional synchronization to keep ticket status updated in both Cloudability and your ITSM platform.
Before you begin
Jira integration
- Configure Jira Cloud in Cloudability.
- Learn about Jira Integration - Setup
ServiceNow integration
Learn about ServiceNow Integration - Setup
Creating a ticket
After the integration is configured:
-
Navigate to the Anomalies on the Anomaly page.
-
From the three-dot menu (⋮) for any anomaly, choose one of the following:

Clicking Create Jira Cloud Issue or Create ServiceNow Issue opens a dialog to create the issue.
If Jira Cloud or ServiceNow credentials have not been configured for your organization, the ticket creation options will be disabled .
Anomaly Alerts for Multiple Users
Cloudability supports sharing anomaly alert subscriptions with other users. This capability enables teams to receive anomaly notifications without requiring each user to configure alerts individually. Admins with the sharing permission can share alert subscriptions with other users, reducing duplication of effort, maintaining consistent alert criteria, and simplifying onboarding for new users.
Once alerts are created, users can view all alerts on the Alert Configuration tab. This page displays all alert subscriptions, including those created by the user and those shared with them. The configuration view also identifies the creator of each alert.
Anomaly Ignore Alerts
Cloudability now supports the Anomaly Ignore Alert functionality. This feature allows users to temporarily ignore anomaly alerts directly from the Alert Configuration page. It helps reduce noise during expected cost events and ensures that only meaningful, actionable alerts are surfaced.
Key Capabilities
- Ignore alerts at the individual anomaly alert level
- Support ignore functionality for shared alerts
- Select preset ignore duration (7, 14, or 30 days)
- Define a custom date range for ignoring alerts.
- Edit the ignore duration (extend or shorten as needed)
- Schedule ignore for a future time period
- Ignore alerts in bulk using the Bulk Anomaly Alert Ignore option
- Automatically resume alerts once the ignore period ends
Frequently Asked Questions
At which frequency are Anomalies detected?
Anomalies are detected every 24 hours, Once the cost data is updated. Our goal is to deliver timely alerts while minimizing unnecessary notifications. Each time the anomaly detection algorithm runs, it re-evaluates and regenerates anomalies for the past seven days.Why do Anomalies change/ disappear?
Each time the anomaly detection algorithm runs, it regenerates anomalies for the past seven days. Within this seven-day window, the model becomes more informed, making it possible for anomalies to change or disappear.- If the amount for the given anomaly changes, it is mainly due to updates in the cost data.
- If an anomaly disappears, it is primarily because the five daily selected tags/ dimensions differ, causing the previous anomaly to be overwritten.
Does Anomaly Detection show downward spend?
No, anomaly detection only shows unusual upward spend.Can we change the way Anomalies are detected?
The formulas that detect an anomaly cannot be changed, however, customers can change the threshold for the notifications they receive.Can a reprocess trigger new Anomalies or alerts?
Yes, Anomalies can appear or disappear as new billing data comes in, or as tag mappings and business mappings are updated.-
Why was I alerted about an Anomaly, but it is no longer visible in the UI?
Cloudability's anomaly detection algorithm identifies anomalies based on the latest available billing data. When an anomaly is detected, an alert is sent to notify the user. However, cloud service providers (CSPs) continuously update billing files, which can lead to changes in reported costs.
If subsequent billing updates modify the total spend for a given day, the anomaly detection algorithm may no longer classify that day's spending as unusual. As a result, the previously detected anomaly is removed from the UI.
Example: If a vendor applies a credit adjustment, reducing the total spend for a specific day, the previously flagged anomaly may no longer be considered unusual and will no longer appear in the UI.
What are the scenarios user will not receive the alert?
Anomalies are detected every 24 hours, Once the cost data is updated. Our goal is to deliver timely alerts while minimizing unnecessary notifications. Each time the anomaly detection algorithm runs, it re-evaluates and regenerates anomalies for the past seven days.- The anomaly reports an unusual spend of $300, but the customer has set a threshold of $350. In this case, an alert will not be sent.
- A user sets a subscription with a specific View, but their permissions change, and they no longer have access to that View. As a result, an alert will not be sent.
- A View is configured to trigger alerts when the tag "team=cldy" appears. If the tag is missing or is set as "team=apptio", the Alerter will not send an alert.
- An anomaly with the same date, total spend, unusual spend, account, tags, and business mappings has already been reported for a particular user. If an identical anomaly is received again, another alert will not be sent.
Can I customize Anomaly Detection?
Yes. Anomaly Detection can be customized by selecting the dimensions you want to monitor through Configurable Dimensions. This allows you to detect anomalies at the level of granularity that best fits your organization's needs.- What happens when an anomaly is detected at both the Service level and the Configurable Cost
Segment?
When an anomaly is detected for the same Service (Account ID, Usage Family, Service Name) and Configurable Dimensions, one of the following scenarios may occur:
Only the Configurable anomaly is reported
- If the anomaly is driven by a single Configurable Dimensions combination and the anomalous spend amount at the Service level is identical to the spend amount at the Configurable Dimensions level, only the Configurable anomaly is reported.
- This helps avoid duplicate reporting of the same anomaly.
Both anomalies are reported
- If the anomalous spend amount at the Service level differs from the spend amount at the Configurable Dimensions level, both anomalies are reported.
- This indicates that the Service-level anomaly is not fully explained by a single Configurable Dimensions combination.