Control-M Usage
Presents the Control-M Usage analysis available in IBM® AD Analyze Client.
Control-M Usage tab shows the information about Control-M sources: application, folder, and job.
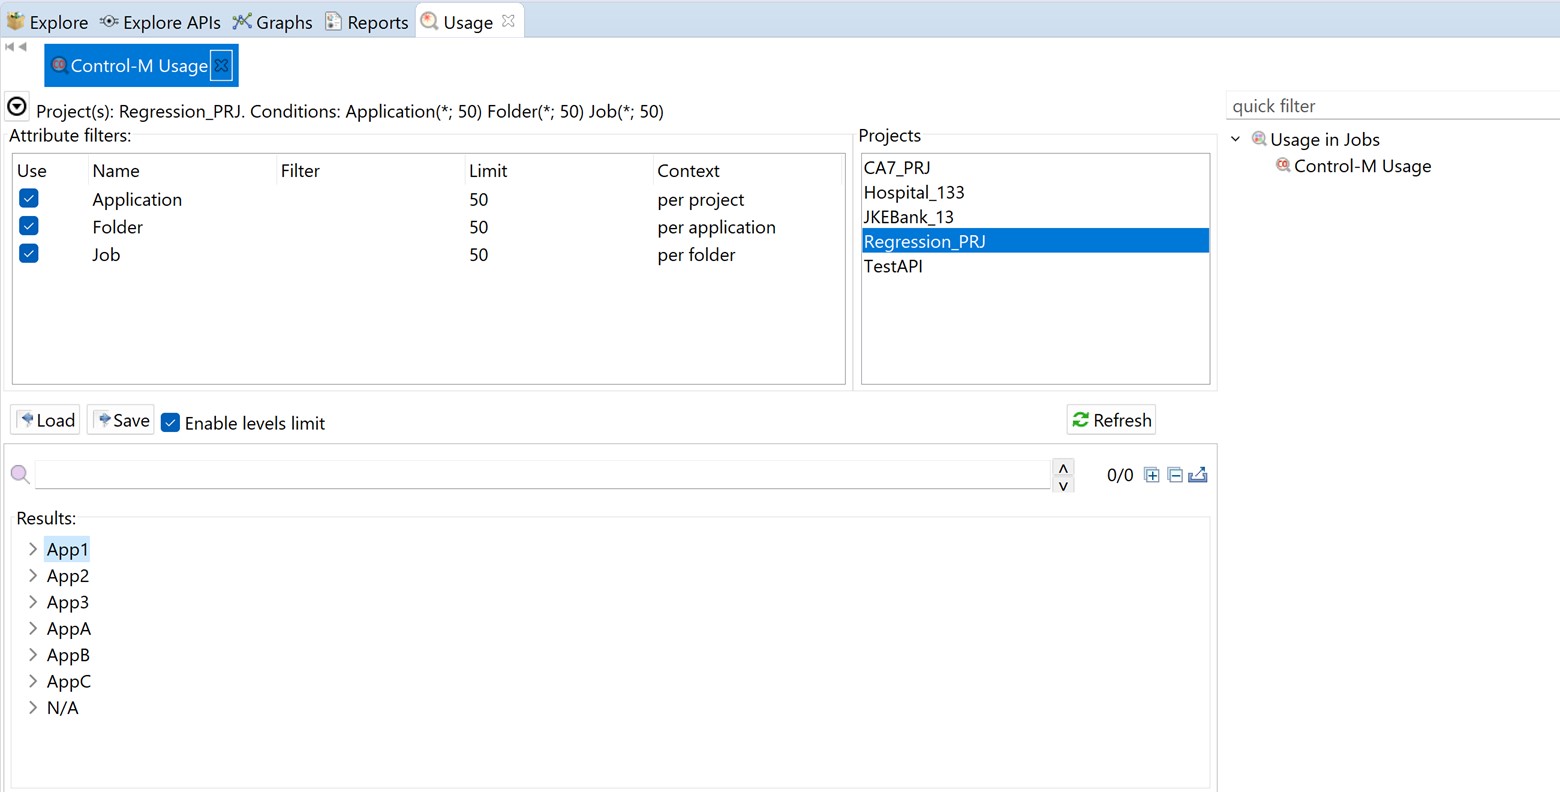
The central part of the screen displays the list of attribute filters. The breadcrumb displays the selected projects, the selected attributes together with the filters set for each attribute.
- "*" is used to search elements, by adding to it either prefixes or suffixes as in "AAA*" or "*AAA"
- "," is used to search multiple elements as in "AAA, BBB, CCC"
To limit the number of attributes of a certain type that are returned by the filtering operation, use the fields in the Limit column. The default limit is 50; the maximum limit can be set in the corresponding Usage Settings section from the Preferences dialog. For more information, see Control-M Usage Settings. The Context column displays the context of the filter operation where relevant. The context of the first attribute filter in the list is the project. The context of any other attribute filter in the list is the attribute above it in the list.
To the right of Attribute filters area, the list of projects is displayed. Use Save to save the current filter configuration. Use Load to load a previously saved filter configuration.
By default, Enable levels limit is selected and the number of elements that are presented in the Results area is limited by the values set in the Limit column. If you deselect this option, the Limit column from the Attribute filters area disappears and the Results area displays all the results of the analysis. Press Apply to apply the selected filters. After the filtering operation is finished, you can use the black arrow button in the upper left corner of Attribute filters area to hide it and maximize the Results area. To see the Control-M Usage parameters in a separate tab, use the arrow button in the upper right corner of the Control-M Usage tab.
- Expand all
- Click this button to expand the tree.
- Collapse all
- Click this button to fold all the tree branches.
- Export Results to CSV File
- Use this button to export the results together with the used filter configuration.
Place the mouse cursor over a node in the tree to display a tooltip that presents the element category and name. When you select a tree node, the area to the right of the screen is updated to display the graphs, reports, and usage analyses that can be generated for the selected element. Also, the Properties view displays the information available for the selected element.
| Node name | Description |
|---|---|
| Application | Displays the application names belonging to a selected project. |
| Folder | Shows the name of the folder belonging to the selected application. |
| Job | Displays the job name that is associated with the folder. |
Node pop-up menu
Select a node from the tree in the Results area then right-click (on the application or job name) to display the pop-up menu. The number of options available depends on the type of node selected. View analysis source and Copy options are available for all nodes. According to the selected node, several Collapse to … Level options might also be available.