Quick start: Refine data
You can save data preparation time by quickly transforming large amounts of raw data into consumable, high-quality information that is ready for analytics. Read about the Data Refinery tool, then watch a video and take a tutorial that’s suitable for beginners and does not require coding.
Service The Data Refinery service is not available by default. An administrator must install either the Watson Studio service or the Watson Knowledge Catalog service on the IBM Cloud Pak for Data platform. To determine whether the service is installed, open the Services catalog and check whether the Data Refinery service is enabled.
Required service Watson Studio or Watson Knowledge Catalog
Your basic workflow includes these tasks:
- Create a project. Projects are where you can collaborate with others to work with data.
- Add your data to the project. You can add CSV files or data from a remote data source through a connection.
- Open the data in Data Refinery.
- Perform steps using operations to refine the data.
- Create and run a job to transform the data.
Read about Data Refinery
Use Data Refinery to cleanse and shape tabular data with a graphical flow editor. You can also use interactive templates to code operations, functions, and logical operators. When you cleanse data, you fix or remove data that is incorrect, incomplete, improperly formatted, or duplicated. When you shape data, you customize it by filtering, sorting, combining or removing columns, and performing operations.
You create a Data Refinery flow as a set of ordered operations on data. Data Refinery includes a graphical interface to profile your data to validate it and over 20 customizable charts that give you perspective and insights into your data. When you save the refined data set, you typically load it to a different location than where you read it from. In this way, your source data remains untouched by the refinement process.
Watch a video about refining data
 Watch this video to see how to refine data.
This video provides a visual method as an alternative to following the written steps in this documentation.
Try a tutorial to refine data
In this tutorial, you will complete these tasks:
- Create a project.
- Open the data set in Data Refinery.
- Review the data with Profile and Visualizations.
- Refine the data.
- Run a job for the Data Refinery flow.
- Create another data asset from the Data Refinery flow.
- View the data assets and your Data Refinery flow in your project.
This tutorial will take approximately 30 minutes to complete.
Task 1: Create a project
You need a project to store the data and the Data Refinery flow.
-
If you have an existing project, open it. If you don't have an existing project, click Create a project on the home page or click New project on your Projects page.
-
Select Analytics project as the project type.
-
Select Create an empty project.
-
On the Create a project screen, add a name and optional description for the project.
-
Click Create.
For more information or to watch a video, see Creating a project.
Task 2: Open the data set in Data Refinery
Follow these steps to add a data asset to your project and create a Data Refinery flow.
- Download the airline-data.csv file (1.5 MB).
- From your project, click the Upload asset to project icon
 .
. - In the Load panel that opens, browse to select the
airline-data.csvfile, and click Open. Stay on the page until the load completes. - On the Assets tab, click the
airline-data.csvdata asset to preview its content. - Click Refine to open a sample of the file in Data Refinery, and wait until Data Refinery reads and processes a sample of the data.
- Close the Information and Steps panels.
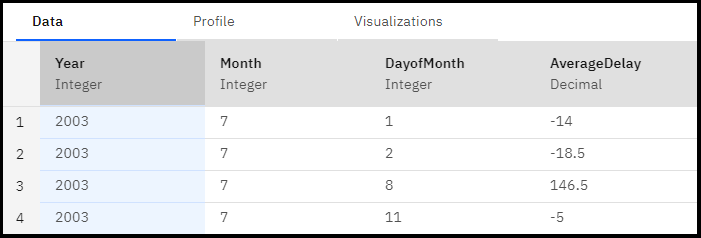
Task 3: Review the data with Profile and Visualizations
Follow these steps to use the Profile and Visualizations tabs to explore the data.
- Click the Profile tab to review the frequency
distribution of the data so that you can find the outliers. The statistics show the interquartile range, minimum, maximum, median and standard deviation in each column.

- Click the Visualizations tab. Select the UniqueCarrier column to visualize. Suggested
charts have a blue dot next to their icons. Use the different perspectives available in the charts to identify patterns,
connections, and relationships within the data.

Tip: Use the Profile and Visualizations pages to view changes in the data as you refine it.
Data Refinery operations
Data Refinery uses two kinds of operations to refine data, GUI operations and coding operations. You will use both kinds of operations in this tutorial.
-
GUI operations can consist of multiple steps. Select an operation from New step. A subset of the GUI operations is also available from each column's overflow menu (
 ).
). When you open a file in Data Refinery, the Convert column type operation is automatically applied as the first step to convert any non-string data types to inferred data types (for example, to Integer, Date, Boolean, etc.). You can undo or edit this step.
-
Coding operations are interactive templates for coding operations, functions, and logical operators. Most of the operations have interactive help. Click the operation name in the command-line text box to see the coding operations and their syntax options.
Task 4: Refine the data
Refining data is a series of steps to build a Data Refinery flow. As you go through this task, view the Steps panel to follow your progress. You can select a step to delete or edit it. If you make a mistake, you can also
click the Undo icon ![]() . Follow these steps to refine the data.
. Follow these steps to refine the data.
- Go back to the Data tab.
- Select the Year column. Click the Overflow menu () and choose Sort descending.
- Click Steps to see the new step in the Steps panel.
- Focus on the delays for a specific airline. This tutorial uses United Airlines (UA), but you can choose any airline.
- Click New step, and then choose the GUI operation Filter.
- Choose the UniqueCarrier column.
- For Operator, choose Is equal to.
- For Value, type the string for the airline for which you want to see delay information. For example,
UA.
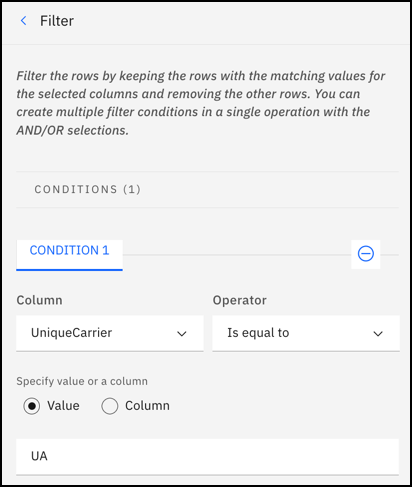
- Click Apply. Scroll to the UniqueCarrier column to see the results.
-
Create a new column that adds the arrival and departure delay times together.
- Select the DepDelay column.
- Notice that the Convert column type operation was automatically applied as the first step to convert the String data types in all the columns whose values are numbers to Integer data types.
- Click New step, and then choose the GUI operation Calculate.
- For Operator, choose Addition.
- Select Column, and then choose the ArrDelay column.
- Select Create new column for results.
-
For New column name, type
TotalDelay.
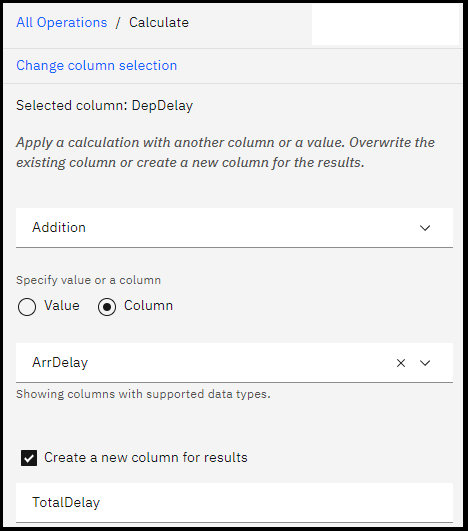
-
Click Apply. The new column, TotalDelay, is added.
-
Move the new TotalDelay column to the beginning of the data set:
- In the command-line text box, choose the select operation.
- Click the word select, and then choose select(`
<column>`, everything()). - Click
`<column>`, and then choose the TotalDelay column. When you finish, the command should look like this:select(`TotalDelay`, everything()) -
Click Apply.
The TotalDelay column is now the first column.
-
Reduce the data to four columns: Year, Month, DayofMonth, and TotalDelay. Use the group_by coding operation to divide the columns into groups of year, month, and day.
- In the command-line text box, choose the group_by operation.
- Click
<column>, and then choose the Year column. - Before the closing parenthesis, type:
,Month,DayofMonth. When you finish, the command should look like this:group_by(`Year`,Month,DayofMonth) - Click Apply.
- Use the select coding operation for the TotalDelay column. In the command-line text box, select the select operation.
Click<column>, and choose the TotalDelay column. The command should look like this:select(`TotalDelay`) -
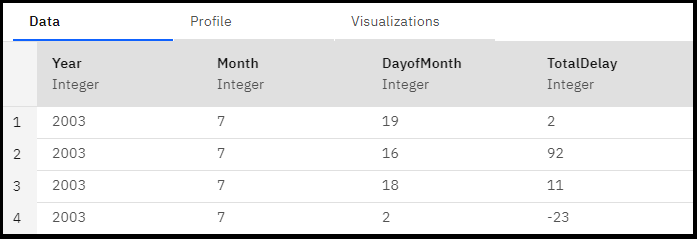
Click Apply. The shaped data now consists of the Year, Month, DayofMonth, and TotalDelay columns.
The following screen image shows the first four rows of the data.
-
Show the mean of the values of the TotalDelay column, and create a new delay column:
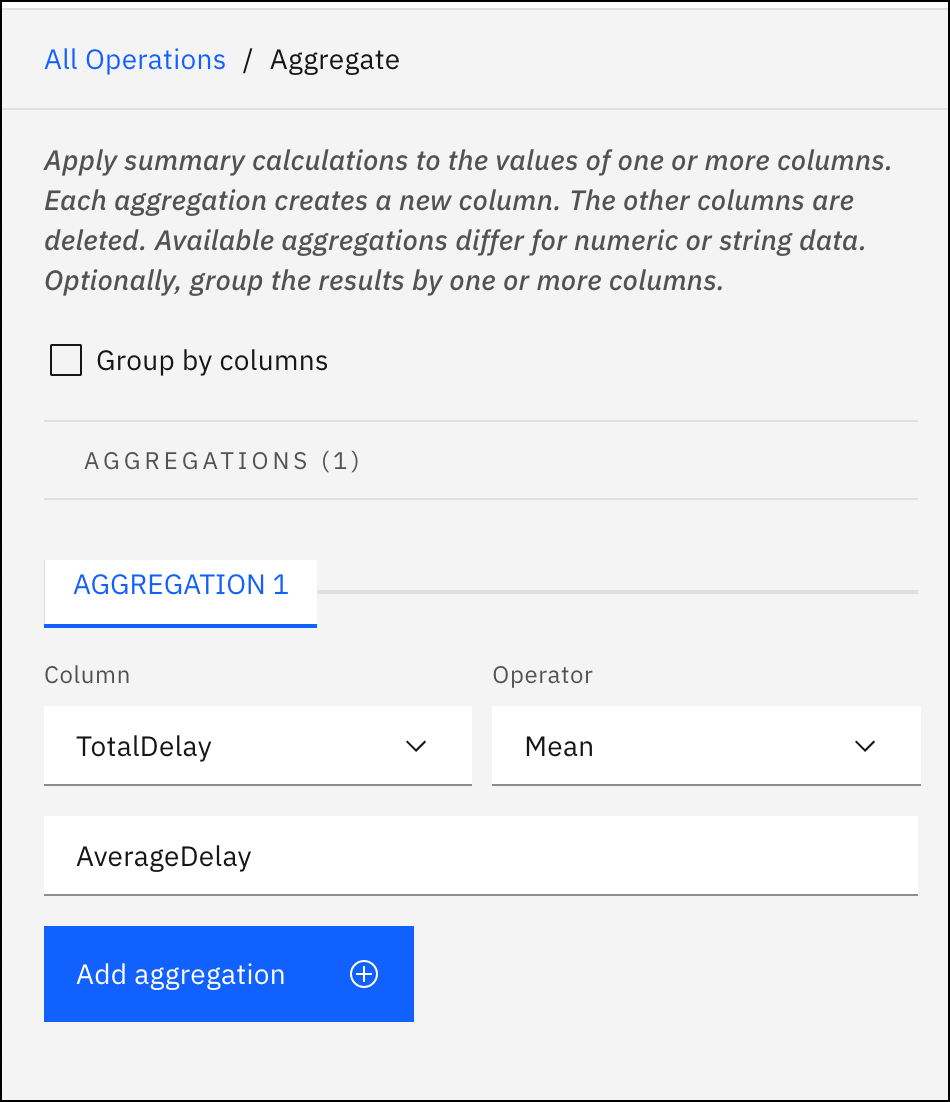
- Make sure the TotalDelay column is selected, and click New step, and then choose the GUI operation Aggregate.
- For AGGREGATION 1, select Mean.
- For Name of the aggregated column, type
AverageDelay.
-
Click Apply.
The new column AverageDelay is the average of all the delay times.
The following screen image shows the first four rows of the data.
Task 5: Run a job for the Data Refinery flow
When you run a job for the Data Refinery flow, the steps are run on the entire data set. You select the runtime and add a one-time or repeating schedule. The output of the Data Refinery flow is added to the data assets in the project.
- From the Data Refinery toolbar, click the jobs icon, and select Save and create a job.

- Type a name and description for the job, and click Next.
- Select a runtime environment, and click Next.
- (Optional) Click the toggle button to schedule a run. Specify the date, time and if you would like the job to repeat, and click Next.
- (Optional) Turn on notifications for this job, and click Next.
- Review the details, and click Create and run to run the job immediately.

- When the job is created, click the job details link in the notification to view the job in your project. Alternatively, you can navigate to the Jobs tab in the project, and click the job name to open it.
- When the Status for the job is Completed, use the project navigation trail to navigate back to the Assets tab in the project.
- Click the Data > Data assets section to see the output of the Data Refinery flow, airline-data_shaped.csv.
- Click the Flows > Data Refinery flow section to see the Data Refinery flow, airline-data.csv_flow.
Task 6: Create another data asset from the Data Refinery flow
Further refine the data set by editing the Data Refinery flow.
- Click airline-data.csv_flow to open the flow in Data Refinery.
- Sort the AverageDelay column in descending order.
- Select the AverageDelay column.
- Click the column Overflow menu (), and then select Sort descending.
- Open the Info panel, in the Details pane, click Edit.
- In the DATA REFINERY FLOW OUTPUT pane, click Edit Output. Change the DATA SET NAME to:
airline-data_sorted_shaped.csv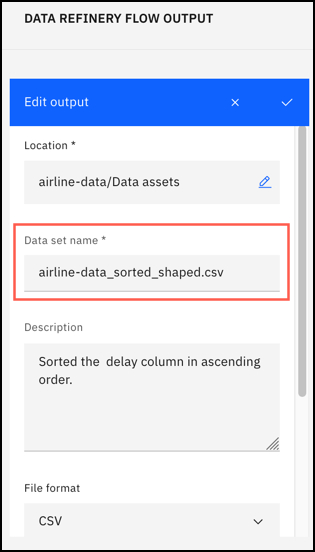
- Click the checkmark to save the change.
- Click Done.
- From the Data Refinery toolbar, click the Jobs icon and select Save and view jobs.

- Select the job for the airline data, and then click View.
- From the Job window toolbar, click the Run job icon.

Task 7: View the data assets and your Data Refinery flow in your project
Now view the three data assets, the original, the first refined data set, and the second refined data set.
- When the job completes, go to the project page.
- Click the Assets tab.
- In the Data assets section, you will see the original data set that you uploaded and the output of the two Data Refinery flows.
airline-data_sorted_shaped.csvairline-data_csv_shapedairline-data.csv
- Click the
airline-data_csv_shapeddata asset to see the mean delay unsorted. Navigate back to the Assets tab. - Click
airline-data_sorted_shaped.csvdata asset to see the mean delay sorted in descending order. Navigate back to the Assets tab. - Click the Flows > Data Refinery flows section shows the Data Refinery flow:
airline-data.csv_flow.
Next steps
Now the data is ready to be used. For example, you or other users can do any of these tasks:
Additional resources
-
View more videos for Data Refinery.
-
Try this additional tutorial for Data Refinery: Collect, cleanse, and enhance your data
 .
.