Working with integrated databases using the Db2 Data Management Console
With IBM® Db2® Data Management Console, you can administer, monitor, manage and optimize the performance of integrated databases. These integrated databases include Db2, Db2 Warehouse, Db2 Big SQL and Data Virtualization.
Service This service is not available by default. An administrator must install this service on the IBM Cloud Pak for Data platform, and you must be given access to the service. To determine whether the service is installed, open the Services catalog and check whether the service is enabled.
Watch the following video for an overview of Db2 Data Management Console.
If you created a Db2 Data Management Console database deployment in your IBM Cloud Pak® for Data cluster, you can access the console and complete the following tasks based on the database type.
Accessing the console
- Sign in to the Cloud Pak for Data web client.
- From the navigation menu, click .
You see the My instances page. The Provisioned instances tab is in front. Your instances are listed in a table.
- Click on the instance you want to work on.
- Click the action icon located at the right end of the page and select Open.
You see the Databases page. Your connections are listed in a table.
Figure 1. Databases page 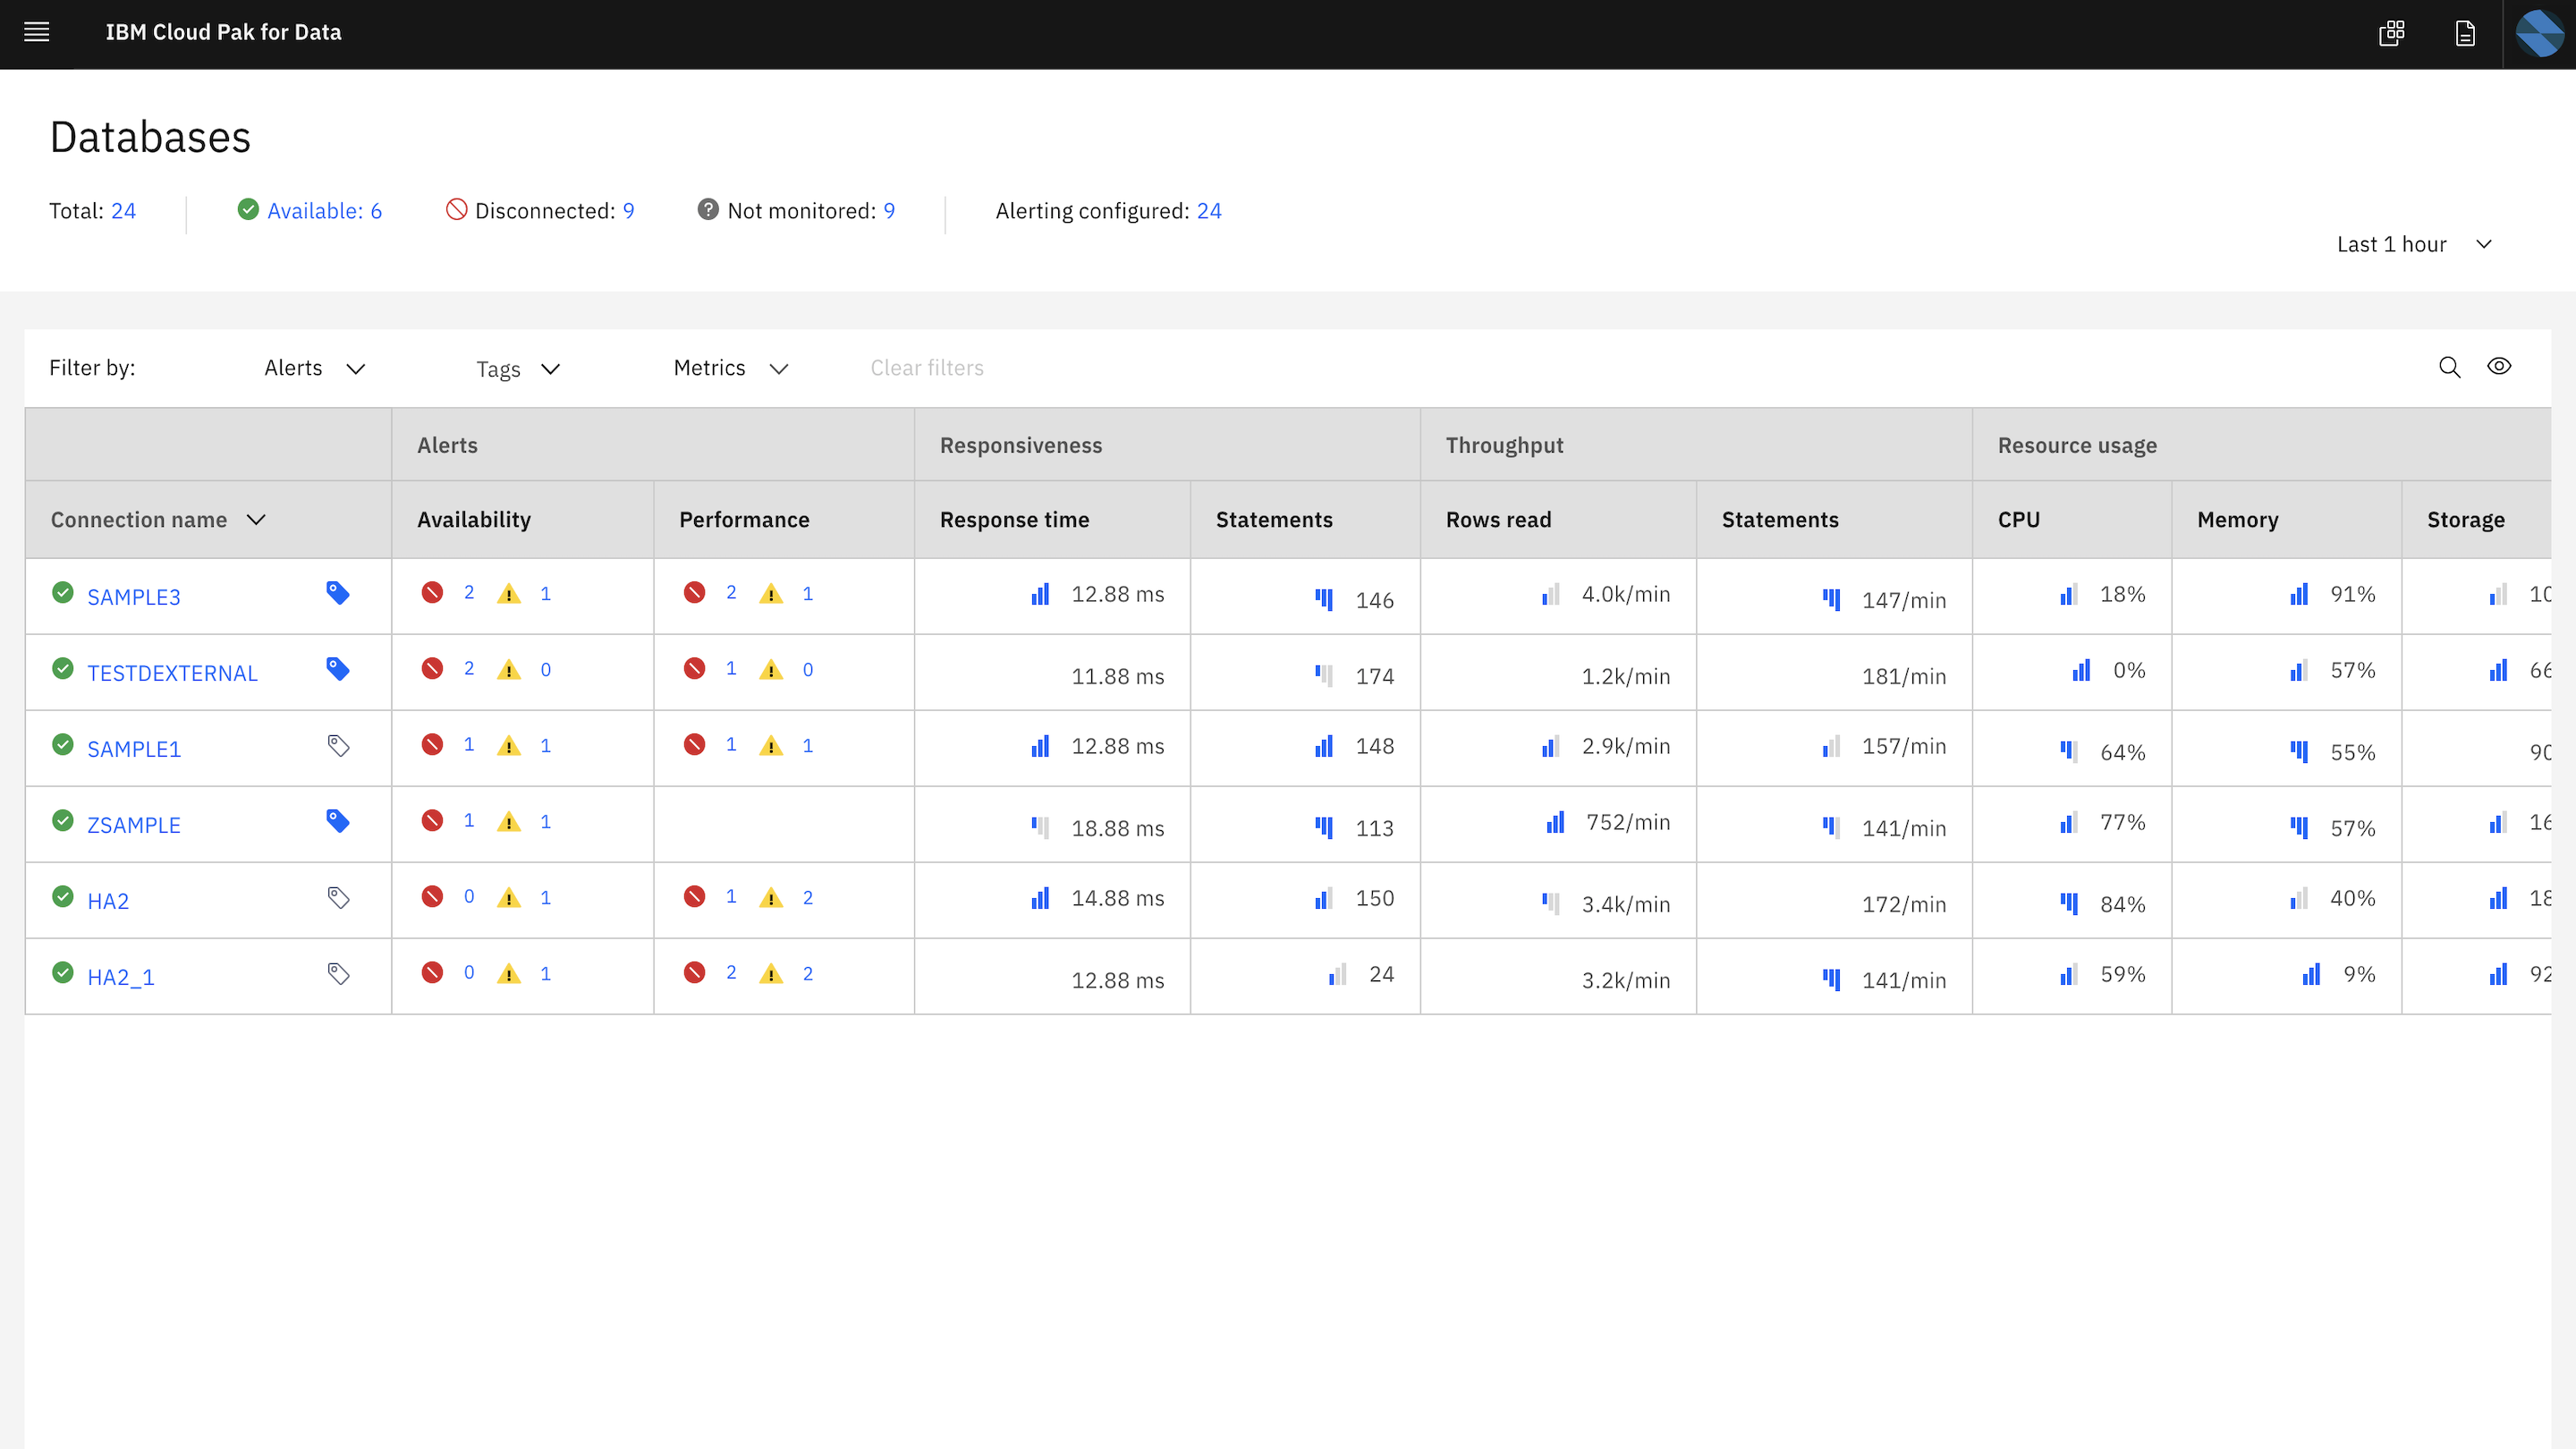
Monitoring integrated databases
You can use the Db2 Data Management Console to monitor the integrated databases.
To monitor the integrated databases:
- Access the console.
- In the Databases page, click on the database connection that you want to
work on.
You can get a high-level view of the health of the database from the page:
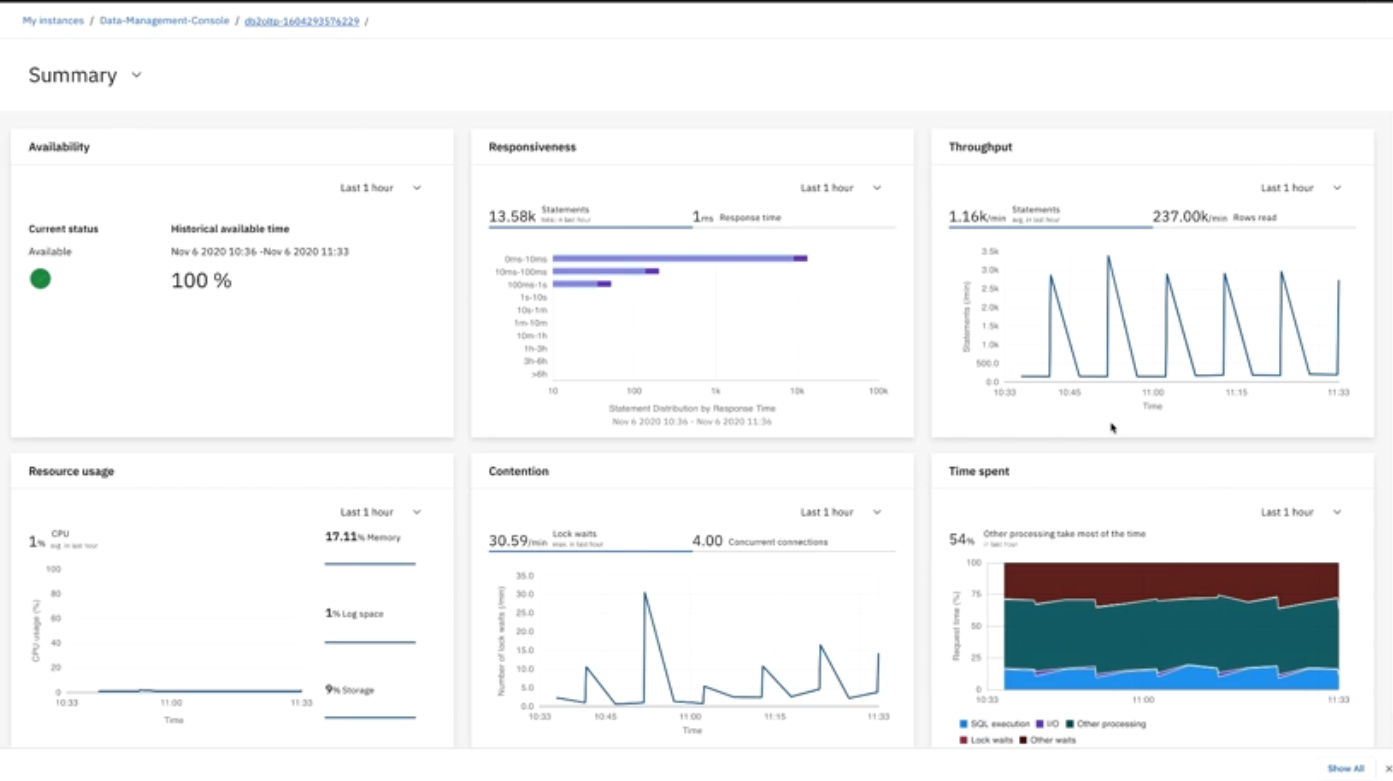
Metric Description Availability Indicates whether the database is up or down, and the relevant alerts. Responsiveness Indicates whether the system is responding well to the incoming requests. Throughput Indicates how much work the system is handling. Resource usage Indicates the resource usage of the database in terms of CPU, memory, storage, and log space. Contention Indicates whether there is any contention between connections. Time spent Indicates the percentage of time that is taken for database calls. -
Click the Summary drop-down menu and select Monitor.

- To get more detailed information about the database, select one of the monitoring metrics option from the Monitor menu.
Loading data
- From your local file system, you can load a single delimited text file (CSV or TXT).
- From Amazon S3, you can load delimited text files (CSV and TXT).
- From IBM Cloud Object Storage, you can load delimited text files (CSV and TXT).
- Access the console.
- In the Databases page, click on the connection that you want to work on.
-
Click the Summary drop-down menu and select Load.
Exploring integrated databases
You can visualize the schema, tables, views, and columns in the integrated databases by using the Explorer feature. You can also see the groups, roles, and users that have permissions to the objects in the database.
To explore the integrated database:
- Access the console.
- In the Databases page, click on the connection that you want to work on.
-
Click the Summary drop-down menu and select Explore.
Running SQL
SQL is a standardized language for defining and manipulating data in a relational database.
You can use the Run SQL feature to run SQL statements and scripts against the database.
- Access the console.
- In the Databases page, click on the connection that you want to work on.
-
Click the Summary drop-down menu and select Run SQL.
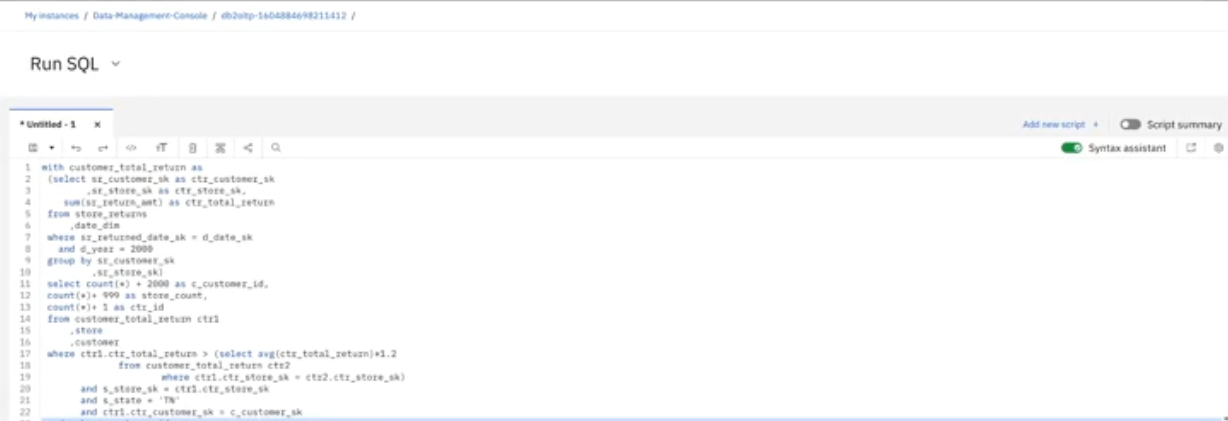
- Create your SQL statement or script.
Report
- Access the console.
- In the Databases page, click on the connection that you want to work on.
-
Click the Summary drop-down menu and select Report.

Monitor profile
- Access the console.
- In the Databases page, click on the connection that you want to work on.
-
Click the Summary drop-down menu and select Settings > Monitor profile.
Event monitor profile
- Access the console.
- In the Databases page, click on the connection that you want to work on.
-
Click the Summary drop-down menu and select Settings > Event monitor profile.