Working with a code coverage comparison report
In the comparison report, the current result is compared with the baseline result. You can view the change in coverage percentage, uncovered line, and executable lines for the result as a whole, or for each file and flow point.
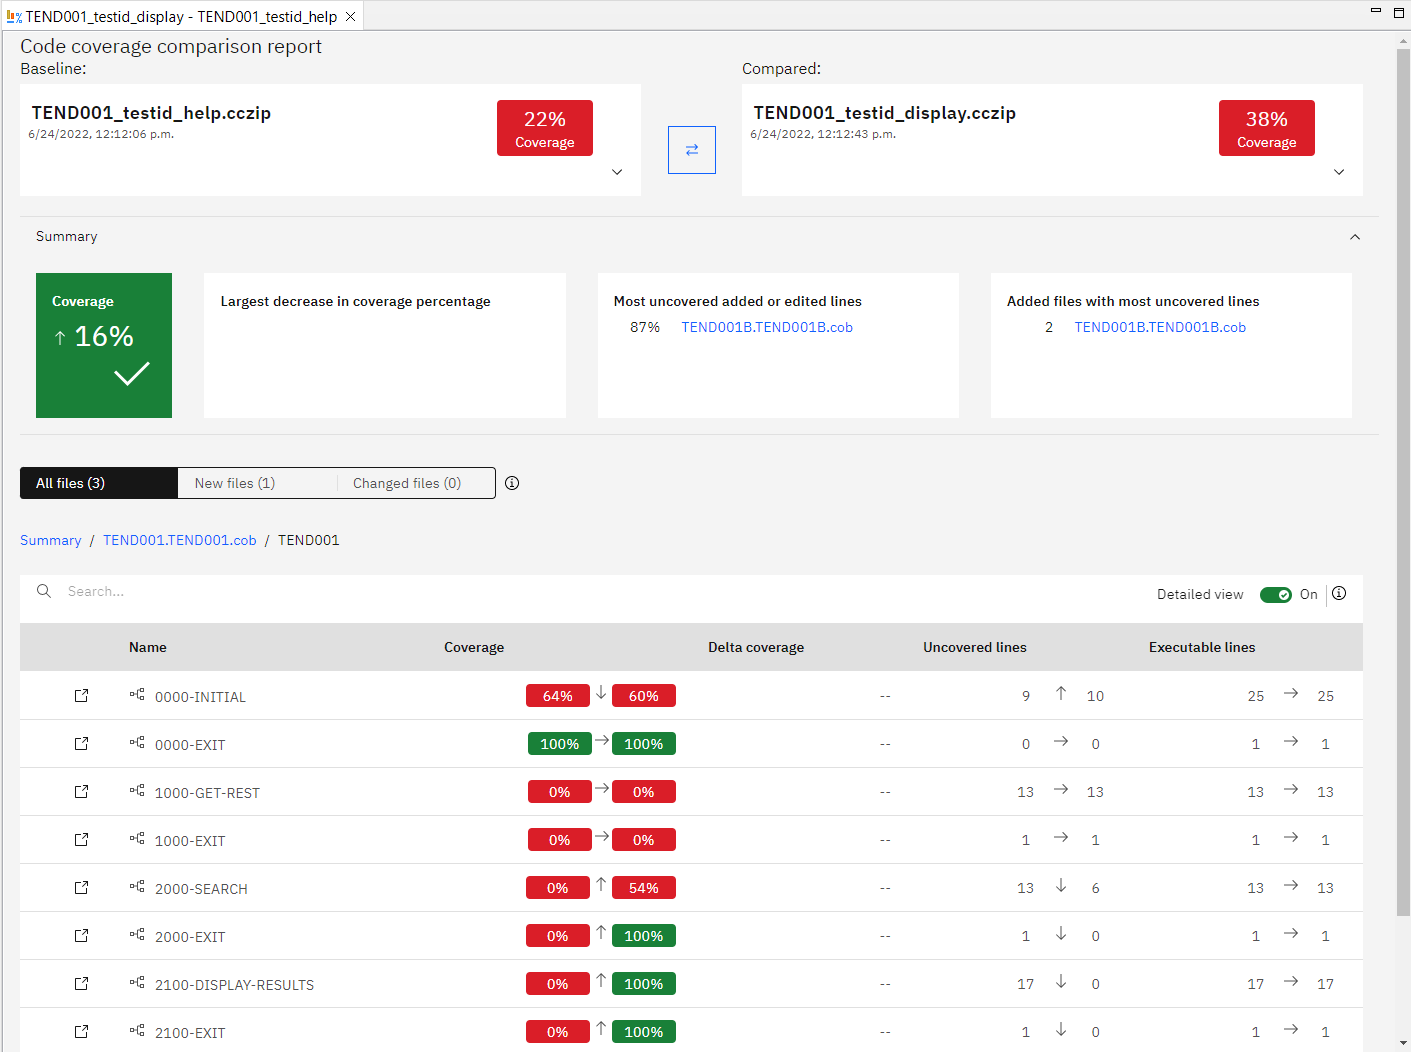
The baseline result is placed before the swap icon ( ), and the compared result is placed after the icon. To change the direction
of comparison, click the swap icon. You can expand the result tile to view the number of files,
modules, executable lines, covered lines, and tests in the result.
), and the compared result is placed after the icon. To change the direction
of comparison, click the swap icon. You can expand the result tile to view the number of files,
modules, executable lines, covered lines, and tests in the result.
- Largest decrese in coverage percentage: Shows files with the largest decrease.
- Most uncovered added or edited lines: Shows files that contain most uncovered added or edited lines.
- Added files with most uncovered lines: Shows added files that contain
most uncovered lines.
The Summary section is collapsible.
Displaying grouped files
- In the All files view, all files in the baseline and compared results are listed, including files deleted from the baseline result and new files added to the compared result.
- In the New files view, all the files added in the compared result are listed.
- In the Changed files view, all changed and deleted files are listed.
At the top of each view, you can find a summary of coverage, uncovered lines, executable lines of the selected files.
Viewing coverage information for each item
- Name: The name of the item displayed in this table. The items can be
files, programs, or flow points in the comparison report.
You can click a file to see objects or programs under the file, and then flow points. When you drill down a file to view the items under it, a breadcrumb appears above the table to indicate the current path. You can also use the breadcrumb to return to an item of higher level in the path.
To find an item in the current path, enter the search string in the search field. The search supports regular expression and is case-sensitive.
To view the compared source file, click the View Source icon (
 ) left to the item name.
 - Coverage: The change in percentage of executable lines that are covered.
- Delta coverage: The coverage percentage of all new and modified lines.
- Uncovered lines: The change in the number of lines that are not executed.
- Executable lines: The change in the number of executable lines.
To view the exact data of the item in the baseline and compared results, enable Detailed view.
The report table is sortable by all the columns.