Working with a code coverage report
In this report, you can view the overall coverage of the selected or merged result, and the coverage for each module, file, or flow point in the result.
In the Summary section, you can find the overall information for the result.
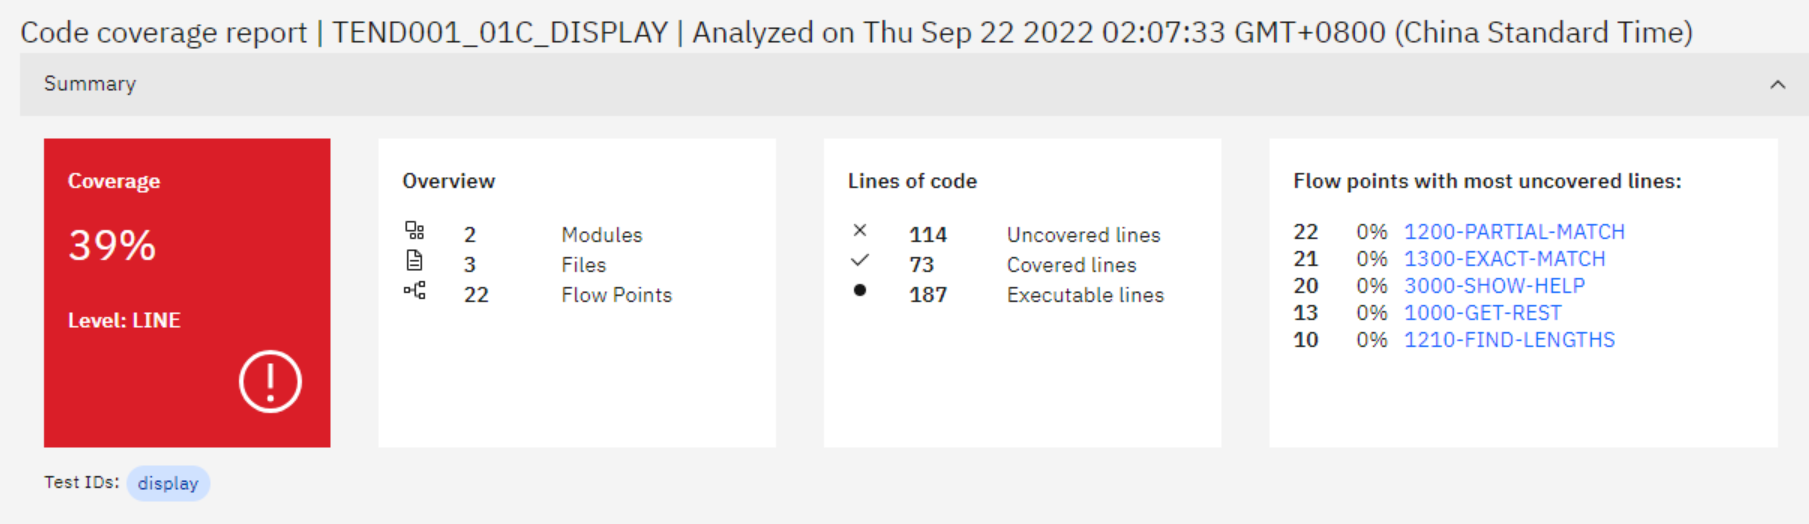
- Coverage: The percentage of executable lines that are covered. The coverage level can either be LINE or FLOWPOINT.
- Overview: Shows the numbers of modules, files, and flow points.
- Lines of code: Shows the numbers of uncovered lines, covered lines, and executable lines
- Flow points with most uncovered lines: The lowest-level flow points with most uncovered lines are listed. You can click the flow point to open the source or listing in an editor.
The files, modules, and flow points can be organized in the following views.
- Table view: You can open it by clicking the Table view (
 ) icon.
 - Tree view: You can open it by clicking the Tree view (
 ) icon.