Costs Dashboard
Costs Dashboard
Before you begin working with this dashboard, be sure you have reviewed the section about Filtering in the chapter "Navigating the User Interface".
The Costs dashboard is a powerful, interactive analytical tool that provides actionable insight into the costs of your organization and budgetary units. The Costs dashboard is particularly useful for the Information Technology Financial Controller (ITFC), Chief Information Officer (CIO), and Chief Financial Officer (CFO) user roles. You can view all of your assets at a global level or view a smaller set of assets by selecting them from lists (in essence, apply local filters on the graphs and table within this dashboard).

Key features of using the Costs dashboard include the following:
- Analyze cost variance and budget compliance.
- Determine which assets and services are the primary items contributing to costs.
- Discover the optimal path to containing and cutting costs.
- Identify what is driving your spending and costs.
- Determine the primary user or order producer.
- View current and projected costs.
- Obtain insights on usage and identify ways to use resources more efficiently and more Cost-effectively.
- View bills and detailed information about costs (Invoice Line Items table).
The Costs dashboard consists of the following components:
- Cost vs Budget graph
- Cost/Budgetary Unit data and donut chart
- Cost/Category data and donut chart
- Cost/Billing Account line graph
- Invoice Line Items table
Reporting
Reporting is available on the Costs dashboard. Cost and Asset Management users can gain full visibility into the Cloud/IT spend in an extractable and reusable format for executive reporting and to share with others who do not have access to the Cost and Asset Management dashboards. Reports continue to generate even when all users have logged out of Cost and Asset Management and will be available when users are logged back in. Once a report is generated, it remains available to download until the next report is generated. An audit log entry is created each time a report is run.
Managing Reports
To run a report:
- Click the Manage Reports
 link near the upper-left corner of the screen. The Manage Reports window displays.

- Click to select a report. Favorite Tags report: Provides the default to send the logged in user an email when report generation is complete. Deselect if you do not want to receive an email notification. This report is provided in .xlsx format. Only the first 100 tag values are considered for analysis. Once a Favorite Tags report is generated, it remains available to download until the next report is generated. AWS Reserved Instances Insight report: This report is provided in .csv format. Chargeback Report: Shows a .csv report with a converted user-defined currency.
Continue with these steps by choosing a report from the three that follow.
Favorite Tags Report (xlsx)
- The Favorite Tags Report gives you the choice to receive email notification when the report is finished generating. The report is set by default to email you. If you do not wish to receive an email notification when your report is ready, click to uncheck the box.
-
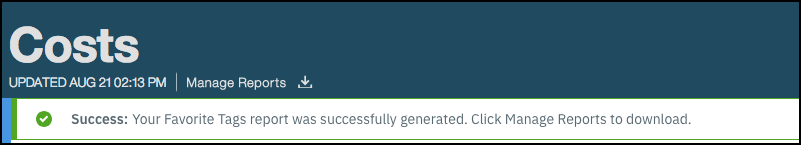
When ready, click Generate report. A message briefly displays on the screen indicating that report generation is in progress, and report status is displayed beside the Manage Reports link. Alternatively click Cancel to close the window without running a report. When the report has finished generating, a status message displays beneath the Manage Reports link.
-
To view the report, click the Manage Reports link again and click the Download last report link beside the last report run. The last report that each logged in user generated remains available for viewing and saving for that viewer.

Note: If report generation fails, the failure is reported in the audit log entry, and Cost and Asset Management attempts to run the report again. Reports may fail due to using the Utilization or Other Filters global filters as they are not supported sources for this report. To proceed, remove them and generate the report. In the event this occurs, you can click Remove & Generate in the Report Error window to remove the filters and regenerate the report, or you can click Cancel and adjust your filters.
AWS Reserved Instances Insight Report
- When ready, click Generate report. A message briefly displays on the screen indicating report status. Alternatively click Cancel to close the window without running a report.
- To view the report, double-click the downloaded report in the lower-left corner of the screen.
Note: If report generation fails, the failure is reported in the audit log entry, and Cost and Asset Management attempts to run the report again. Reports may fail due to using the Utilization or Other Filters global filters as they are not supported sources for this report. To proceed, remove them and generate the report. In the event this occurs, you can click Remove & Generate in the Report Error window to remove the filters and regenerate the report, or you can click Cancel and adjust your filters.
Chargeback Report
- When you select the Chargeback Report, the Manage Reports window displays your options.

- You can click Download last report to view the last Chargeback report you ran.
- You can click the down-arrow to select a currency to convert to and enter an exchange rate in the corresponding text box.
- You can click See all reports to return to the previous Manage Reports window.
- You can click Cancel to close the Manage Reports window without generating or viewing a report.
- When you are ready, click Generate Report. A message briefly displays on the screen indicating that report generation is in progress. When report generating is complete, the .csv report is available for viewing in the lower-left corner of the screen. Double-click to open the .csv report.