Smart Alerts
Smart Alerts for application perspectives provide you with out-of-the-box blueprints, such as slow calls, erroneous calls, HTTP status codes, and throughput. In addition, you can select from several threshold types, including ones that apply statistical models. For each issue created by the alert, you can also see the number of impacted users and the total users for that application perspective during the alert period.
Adding an alert
- On the sidebar, click Applications.
- Click the name of your application.
- Finally, click Add Smart Alert.
Simple mode
By default, you create an alert in the simple mode, which involves the following steps:
- Select an alert.
- Confirm your scope.
- Select an alert channel.
Simple mode enables you to select alerts with zero configuration so that you don't need to create queries or define thresholds.
To create an alert in advanced mode, which allows you to investigate and modify any automatically configured alert setting, click Switch to Advanced Mode.
Select an alert
Select one of the following predefined blueprints that you want to create an alert for.
| Blueprint | Description |
|---|---|
| Slow Calls | Select Slow Calls to receive an alert when calls to selected services and endpoints of this Application Perspective are slower than usual. |
| Erroneous Calls | Select Erroneous Calls to receive an alert when the rate or number of erroneous calls for selected services and endpoints of this Application Perspective is higher than normal. |
| HTTP Status Codes | Select HTTP Status Codes to receive an alert every time when matching HTTP Status Codes occur more often than usual. |
| Throughput | Select Unexpectedly Low Number of Calls or Unexpectedly High Number of Calls to receive an alert when the number of calls for selected services and endpoints of this Application Perspective is anomalously low or high. |
Select your scope
Here you can choose services and endpoints within the Application Perspective view on the Instana user interface. The application perspective from which you create the Smart Alert is selected by default as the initial scope. By applying the Unbounded Analytics queries, you can further scope the alert to a specific subset of calls both horizontally and vertically. For example, by call type, service name, endpoint name or infrastructure attributes such as Kubernetes labels.
Add alert channels
To add alerts channels, click Select Alert Channel, and select the channels to send the alerts. In Smart Alerts for applications, you can add different alert channels for different severities, the selected channels in Simple mode are automatically assigned with the default severity level. The default severity level is Warning. For information about creating channels, see Alert Channels.
Advanced mode
To have a full understanding and control over your alerts, advanced mode helps you to inspect the configurations of each preconfigured alert and modify the configurations if it's needed. In addition to the configurations that are available in simple mode, the advanced mode offers the following configurations.
Trigger
Select one of the predefined blueprints that you want to be alerted for. For more information about different blueprint types, see Select an alert.
Type of Threshold
When you set up a Smart Alert, you can choose to use static or adaptive thresholds.
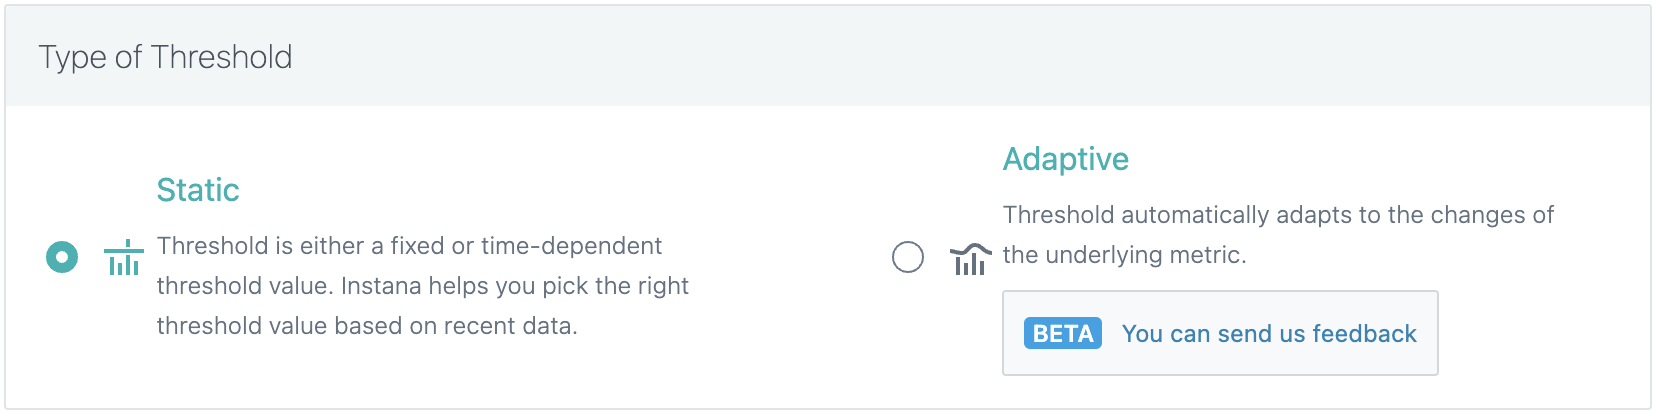
Static
Static thresholds do not change after the Smart Alert is created. The threshold itself can be either a simple constant value, or can account for seasonal variations that occurred in the past at the time of creation of the Smart Alert configuration. You can imagine the later one as a lookup table for every point in time of the day or week that is precomputed once based on historic data.
The threshold might be no longer relevant after the underlying metric is changed significantly. In response, the threshold can be manually adjusted or recalculated at any point in time. For more information, see Alert Threshold.
When to use static threshold
Static thresholds work best for blueprints like Slow Calls or Erroneous Calls in the following situations:
- Irrespective of any seasonality of the underlying metric. It is undesirable for the metric to go larger than or lower than a constant value.
- The underlying metric is seasonal, and therefore different thresholds exist depending on the point in time of the day or week. But these thresholds themselves don't change over time, and gradual changes to these thresholds over long periods of time is undesirable.
Adaptive
Adaptive thresholds continuously evolve and adjust themselves with new data that is observed by Instana. This means that the threshold continuously accounts for seasonal changes to the underlying metric without any human intervention. For more information, see the adaptive threshold documentation.
When to use adaptive threshold
Adaptive thresholds work best for blueprints such as Throughput or generally for the following situations:
- The underlying metric is not seasonal. The threshold is expected to gradually change over time, but any sudden deviation from this trend is undesirable.
- The underlying metric is seasonal and different thresholds exist for different times of the day or week. The thresholds themselves are expected to gradually change over time, but any sudden deviation from this trend is undesirable.
Scope
The application perspective from which you create the Smart Alert is selected by default as the initial scope.
You can filter the overall calls to a subset by using our query language. The calls that match the query-based filter are "in scope", and all the other calls are "out of scope", and therefore not considered.
By applying the Unbounded Analytics queries, you can further scope the alert to a specific subset of calls both horizontally and vertically. For example, use the call type, service name, endpoint name or infrastructure attributes such as Kubernetes labels.
Choose the scope of individual alerts
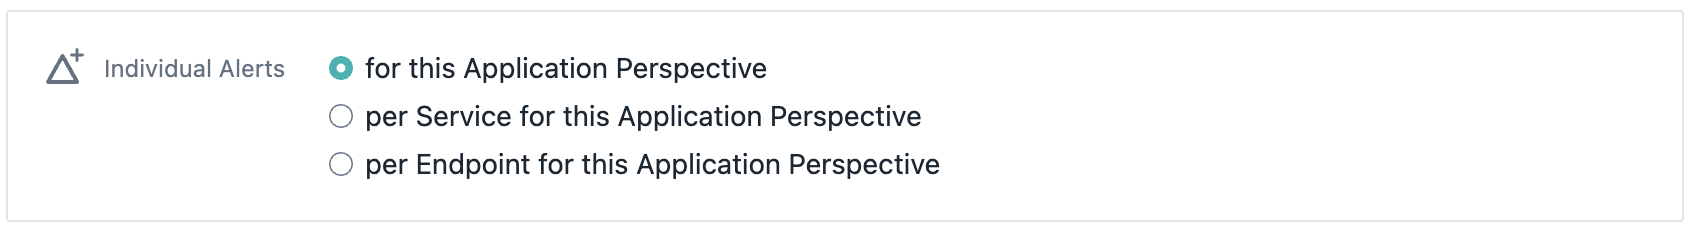
The following options control the granularity of alert evaluation and notifications, progressing from coarse-grained (application-level) to fine-grained (endpoint-level) alerting.
For this application perspective
This option evaluates metrics at the *application perspective level*. Since an application perspective is a collection of services, all calls across all services within the perspective are aggregated into a single metric. The alert threshold is evaluated against this aggregated metric, and when violated, a single alert notification is sent for the entire application perspective.
Select this option for: High-level application health monitoring where you need to know issues in the overall application, regardless of which specific service or endpoint is affected.
Per service for this application perspective
This option evaluates metrics at the *service level*. Each service within the application perspective gets its own metric, calculated by aggregating all calls to that service's endpoints. The alert threshold is evaluated separately for each service, and when violations occur, separate alert notifications are sent for each affected service.
Select this option for: Service-level monitoring where you want to identify which specific services are experiencing issues, while still aggregating metrics across all endpoints within each service.
Per endpoint for this application perspective
This option evaluates metrics at the *endpoint level* (finest granularity). Each endpoint within each service gets its own metric. The alert threshold is evaluated separately for each endpoint, and when violations occur, separate alert notifications are sent for each affected endpoint.
Select this option for: Detailed endpoint-level monitoring where you need to pinpoint exactly which endpoints are experiencing issues.
Choose between inbound calls and all calls
Since an application perspective typically includes more than one service, there is a need to determine which calls are in scope of this Smart Alert.
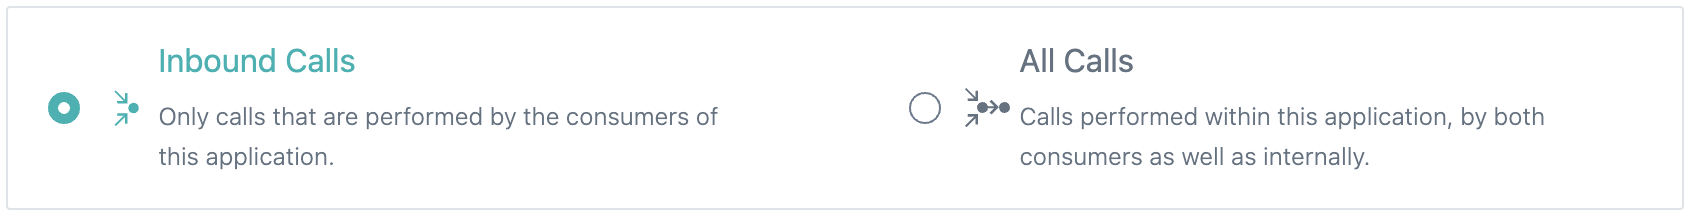
Choose inbound calls to restrict calls to this application perspective only (from the frontend or any upstream service). Calls between services within this application perspective are excluded.
Choose all calls to include not only calls to this application perspective as a destination (from the frontend or any upstream service) but also calls between services within the application perspective.
Include and exclude internal or Synthetic calls
Optionally, you can include internal or Synthetic calls. By default, both of such calls are excluded.
An internal call is a particular type of call that represents work that is done inside of a service. It can be created from intermediate spans that are sent through custom tracing. For more information on internal calls, see Concepts of Tracing.
Synthetic calls are those with an Synthetic endpoint as the destination, such as calls to health-check endpoints.
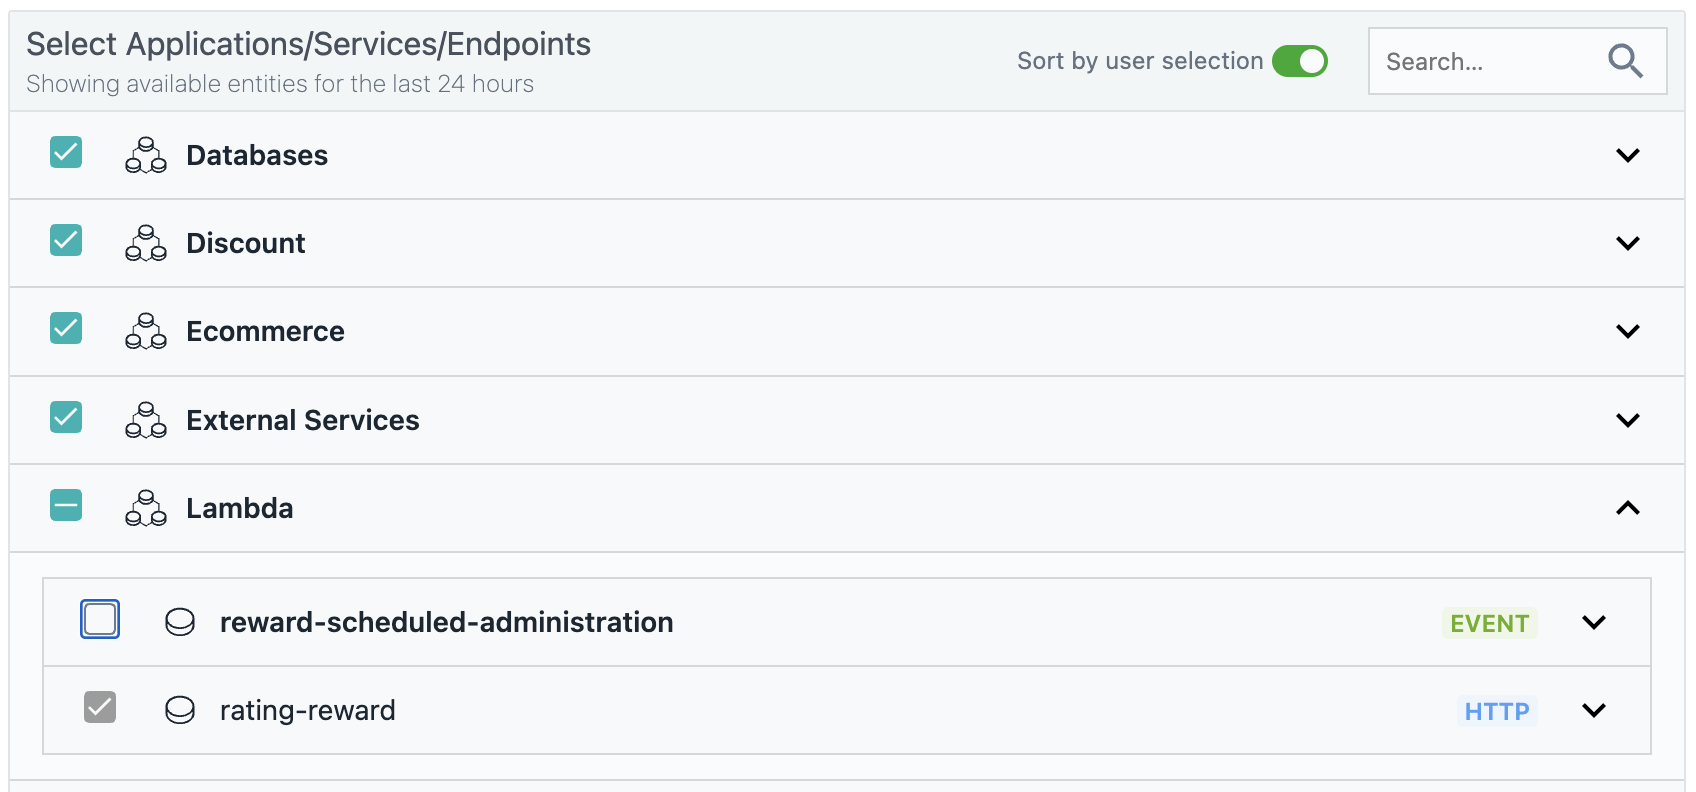
Select individual services or endpoints
Optionally, use the drop-down list against the name of the application perspective to manually select or exclude individual services that this Smart Alert must restrict its scope to. Within a selected or excluded service, the selected scope can be further defined for each of its endpoints.
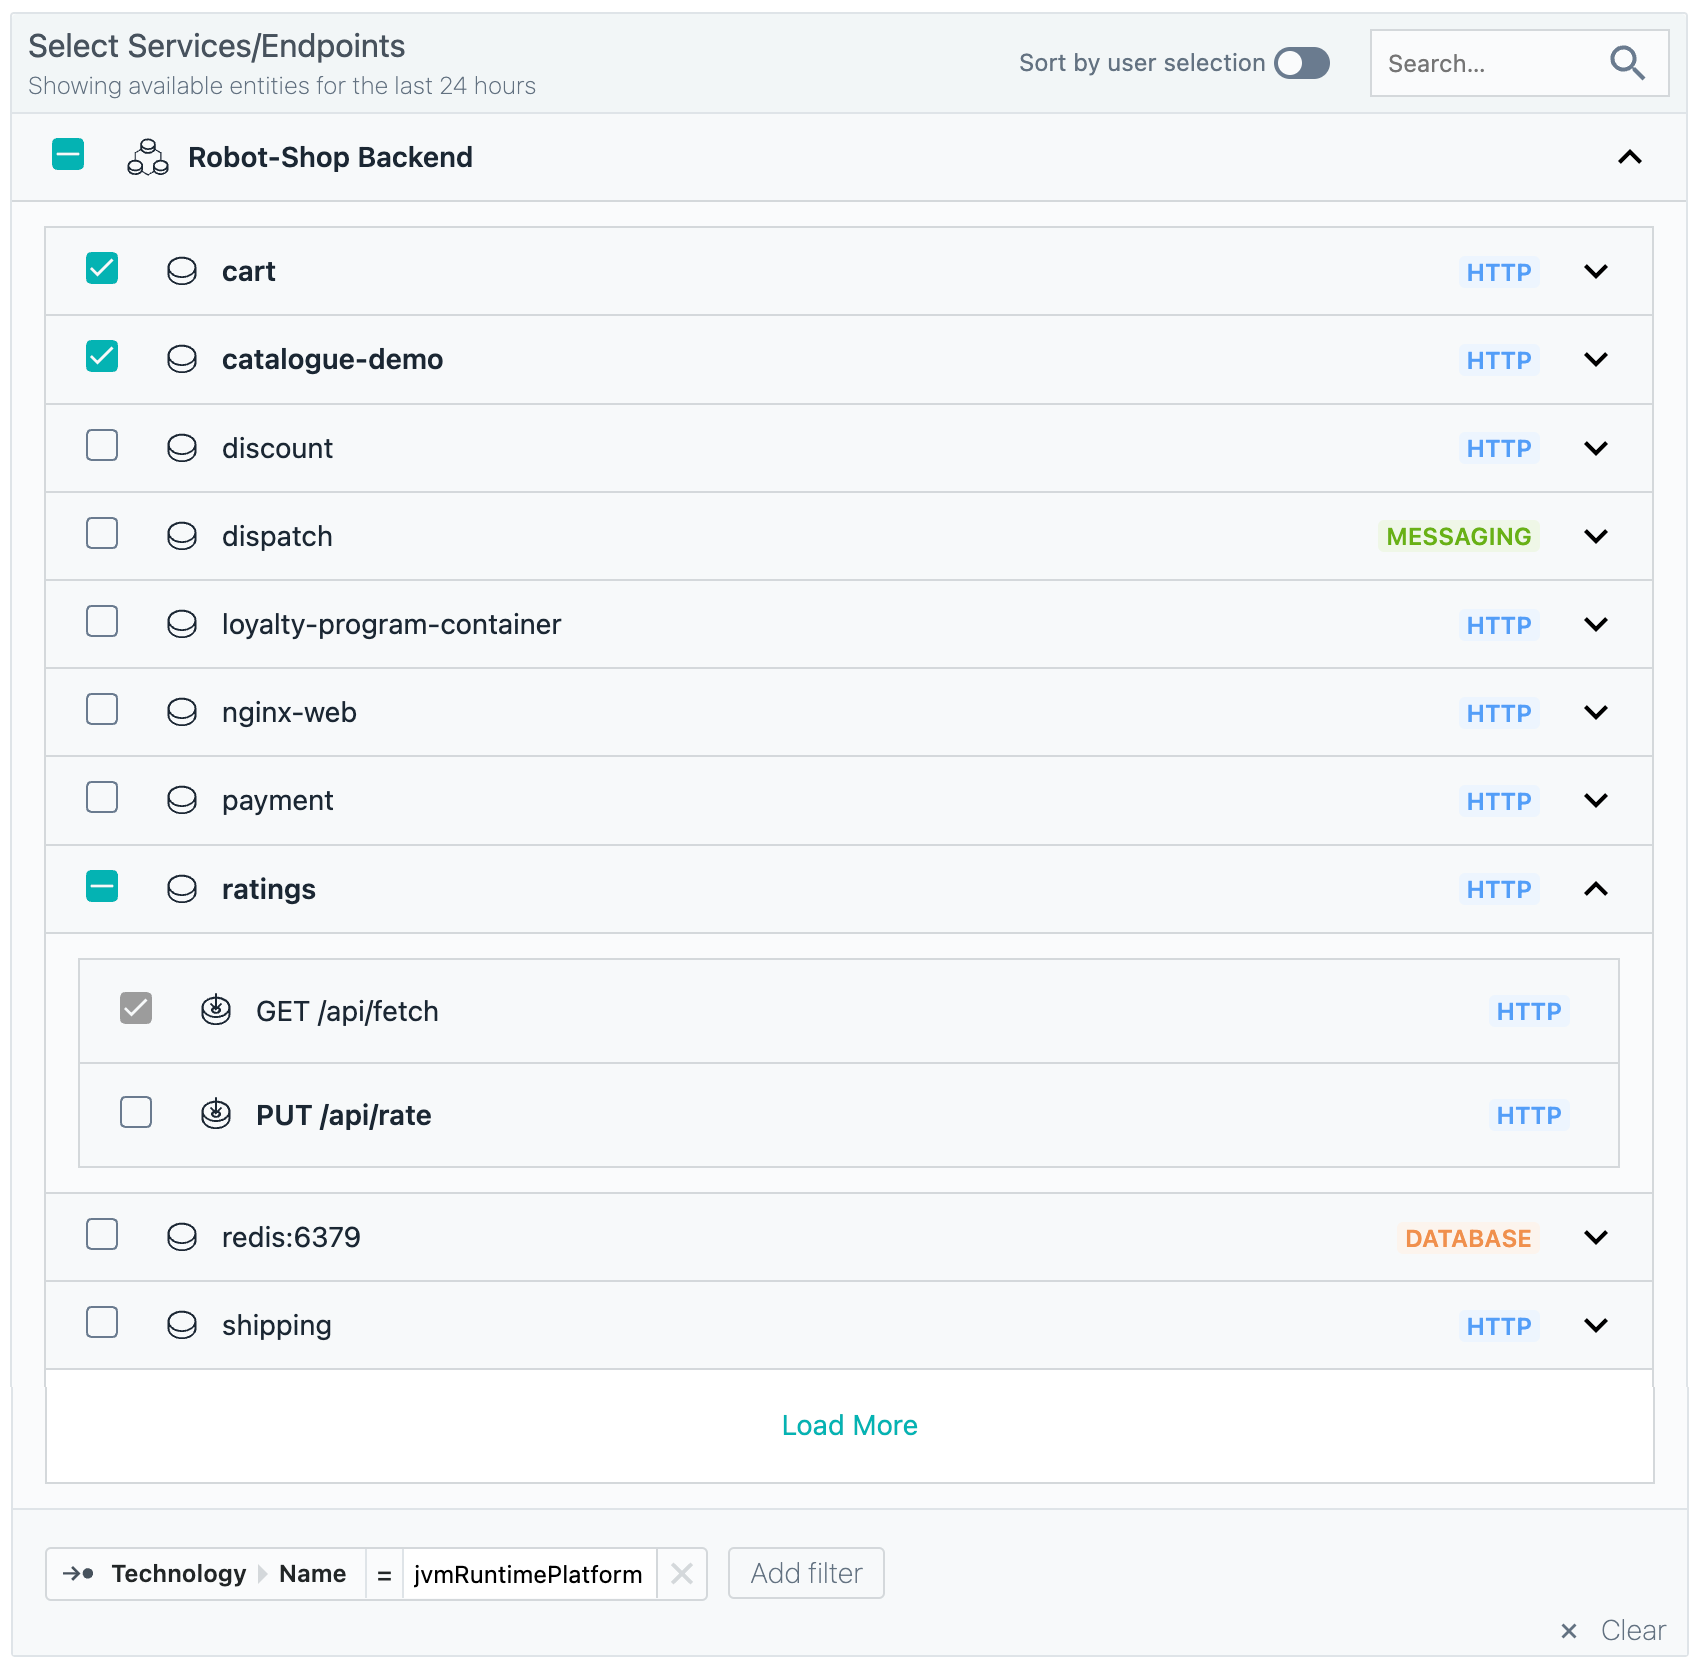
Enabling Sort by user selection keeps the selected services and endpoints on top.
If you use the search field, the selection tree is reduced to just services and endpoints whose name matches the search keyword.
Optionally, use Add filter for more advanced and granular filtering requirements that use arbitrary boolean logic.
Alert threshold
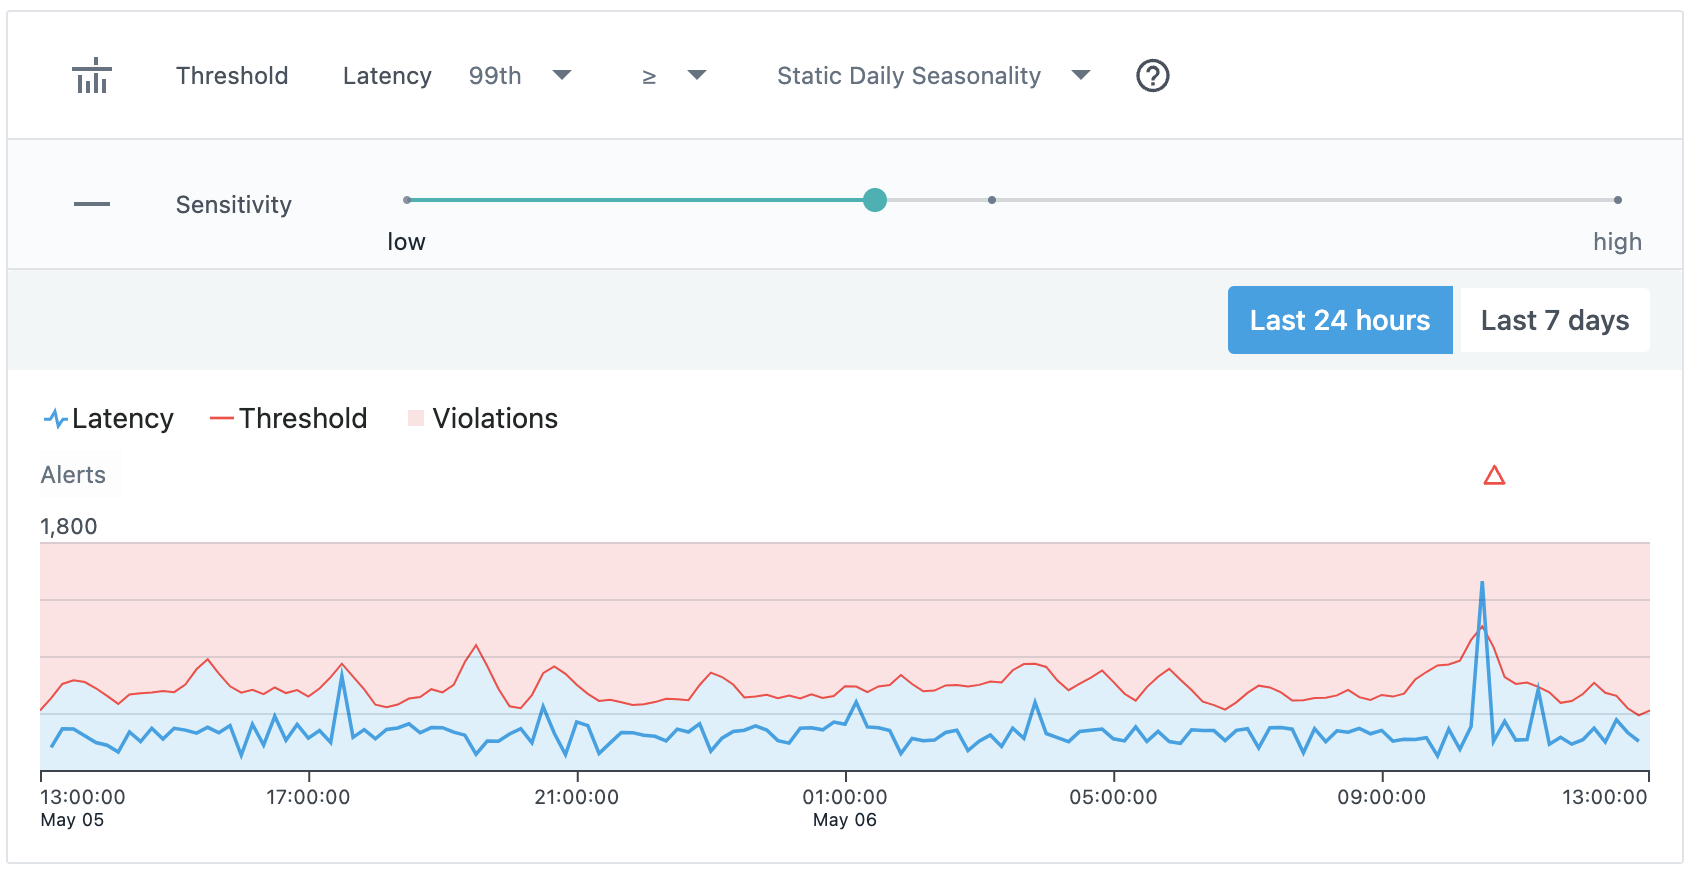
In this section, you can configure the alert threshold of the Smart Alert. The underlying metric is an aggregation of calls that relate to the given Application Perspective. When the alert threshold of the Smart Alert is configured, the alert preview of the dialog shows the metric, threshold, and the violations on historic data for the last 24 hours or 7 days.
Choose a metric
This step is relevant when you choose the Slow Calls blueprint, where the following options are available to choose from: arithmetic mean, minimum, and maximum, along with 25th, 50th, 75th, 90th, 95th, 98th and 99th percentiles.
Choose threshold operator
Based on the chosen blueprint, you have the option between <, <=, >, >=.
Choose threshold type
Here you can choose among the following static threshold types:
- Static Threshold: Takes a constant value as threshold.
- Static Daily Seasonality: Uses a threshold that captures the daily repeating patterns of the metric where every day behaves roughly the same, but is different throughout the day. As an example, an application that receives more calls during the day compared to during the evening.
- Static Weekly Seasonality: Uses a threshold that captures the weekly repeating patterns of the metric where every day of a week behaves roughly the same, but is different throughout the week. As an example, an application that receives more calls on workdays compared to the weekend.
For Static Daily Seasonality, at least 5 days of continuous metric data is required, but 7 days of data is recommended. For Static Weekly Seasonality, at least 2 weeks of continuous historic metric data is required. The Smart Alert cannot be created when these requirements are not met.
For Adaptive Threshold, at least 14 days of continuous metric data is required. If this requirement is not fulfilled, the Smart Alert can still be created. Issue detection and alerting will start working as soon as the data requirement is met to initialize the used model.
Choose threshold value or sensitivity
If you choose Static threshold, Instana selects a warning severity by default and provides a suggested threshold value. You can either use this suggested value or define a custom value manually. To configure an extra severity level, such as critical, enable the Critical checkbox and provide a separate threshold value that triggers the alert as critical.
When you select a sensitivity level, Instana automatically assigns a warning severity. You can adjust the sensitivity level by using a slider. To define a separate sensitivity level for critical severity, select the Critical checkbox and configure the sensitivity as needed.
Increasing the sensitivity narrows the upper and lower boundaries for anomaly detection, which results in more alert notifications. Decreasing the sensitivity broadens these boundaries, reducing the number of alerts. This adjustment sets the expected value range for the metric. Based on the threshold operator in use, a metric that exceeds either boundary is considered as a violation and might trigger an alert.
Time threshold
For the alert that is triggered, you can use the time threshold to impose more conditions on how the defined threshold on the metric are violated.
In this section, you choose the evaluation window or granularity, which is the bucket of time in which calls are evaluated within the Smart Alert. Furthermore, you can make finer adjustments to how alerts are detected and when alerts are triggered. Changes to this section updates the alert preview that is shown in the dialog's chart.
Persistence over time
Choose this option if you want to delay the dispatch of alert notifications until the given number of consecutive evaluation windows are violated.
Follow the steps:
- Choose the evaluation window or granularity.
- Choose how many such evaluation windows need to be violated consecutively before the alert notification gets fired.
Number of violations over time
Choose this option if you want to delay the dispatch of alert notifications until N out of M evaluation windows are violated.
An example of violations over time time threshold configuration is shown in the following image. With a metric evaluation granularity of 5 minutes, an alert is triggered when at least 2 metric violations occur within the last 15 minutes.
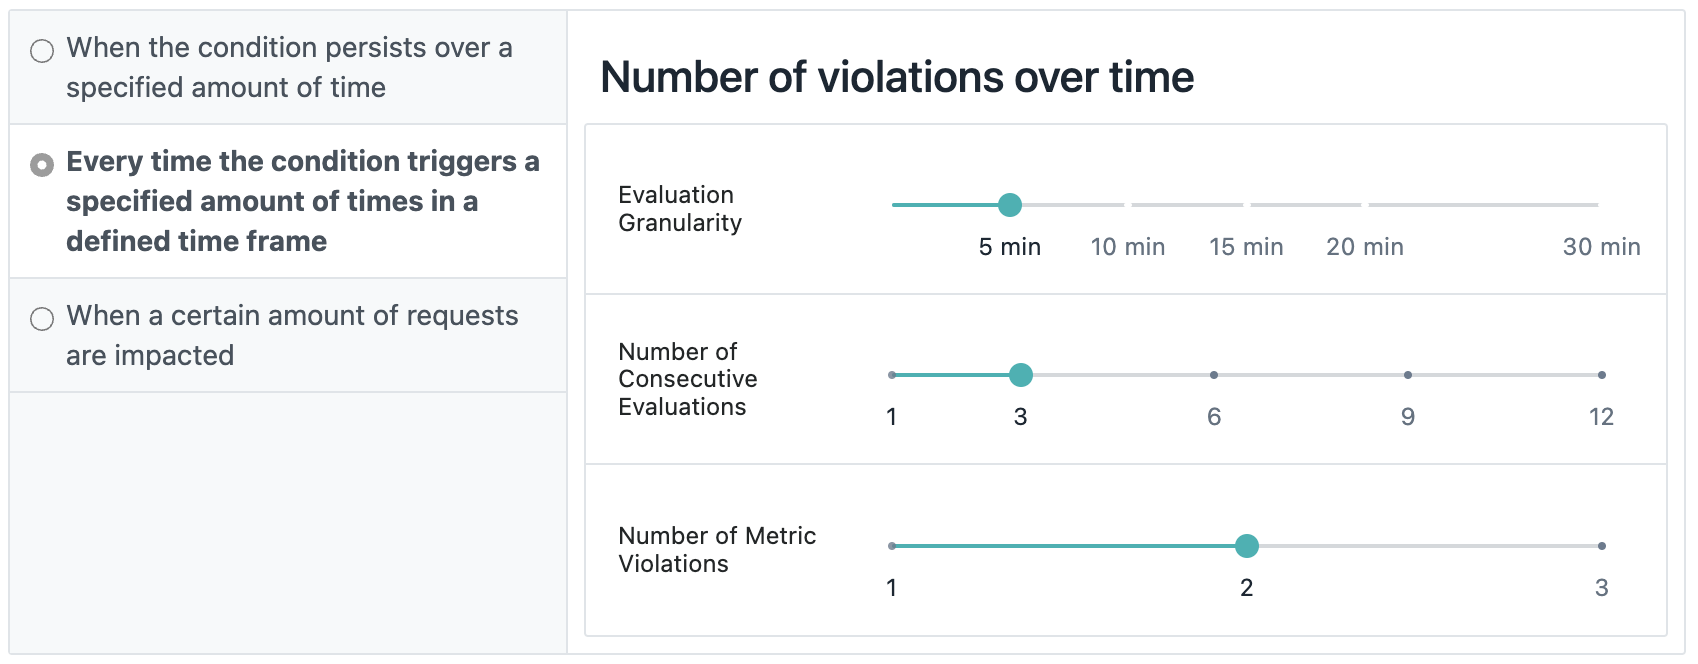
Follow the steps:
- Choose the evaluation window or granularity. Individual metric values are aggregated into windows of this size.
- Choose how many evaluation windows (M) to track.
- Set the minimum number of tracked evaluation windows that need to be violated to send the alert notification.
Two separate evaluation cycles with this configuration are shown in the following example.

Metrics are aggregated into 5-minute evaluation windows. If 2 out of the last 3 evaluation windows are violated, an alert is sent.
Trace impact
Choose this option if you want to delay the dispatch of alert notifications until a specified number of traces are impacted.
Follow the steps:
- Choose the evaluation window or granularity.
- Enter the number of traces that violate the threshold within the evaluation window.
Alert channels
You can choose the alert channels to send the alert notifications. In Smart Alerts for applications, you can set different alert channels for different severities.
If a threshold value is set for warning and critical severities, you can set the alert channels for each severity. If a threshold value is set for both severities, all the alert channels are selected for the warning severity by default.
The following image shows alert channels with both severities configured:

If a threshold value is set only for one severity, the severity is displayed for every alert channel as the alert level.
In the presence of gaps for a metric that is not SUM aggregated, such as latency or error-rates, Instana preserves the current alert state until the next metric value is seen. For example, this behavior is helpful when a Smart Alert is defined for an application that receives only infrequent traffic, but suffers from a persistent problem. Therefore, these periods without any application traffic do not cause repetitive alerts. However, the absence of a single call for more than 3 hours causes any active alert to be closed.
The following image shows alert channels with one severity configured:

Alert properties
In this section, you can optionally configure various properties related to the alerts that are created by using the Smart Alert configuration.
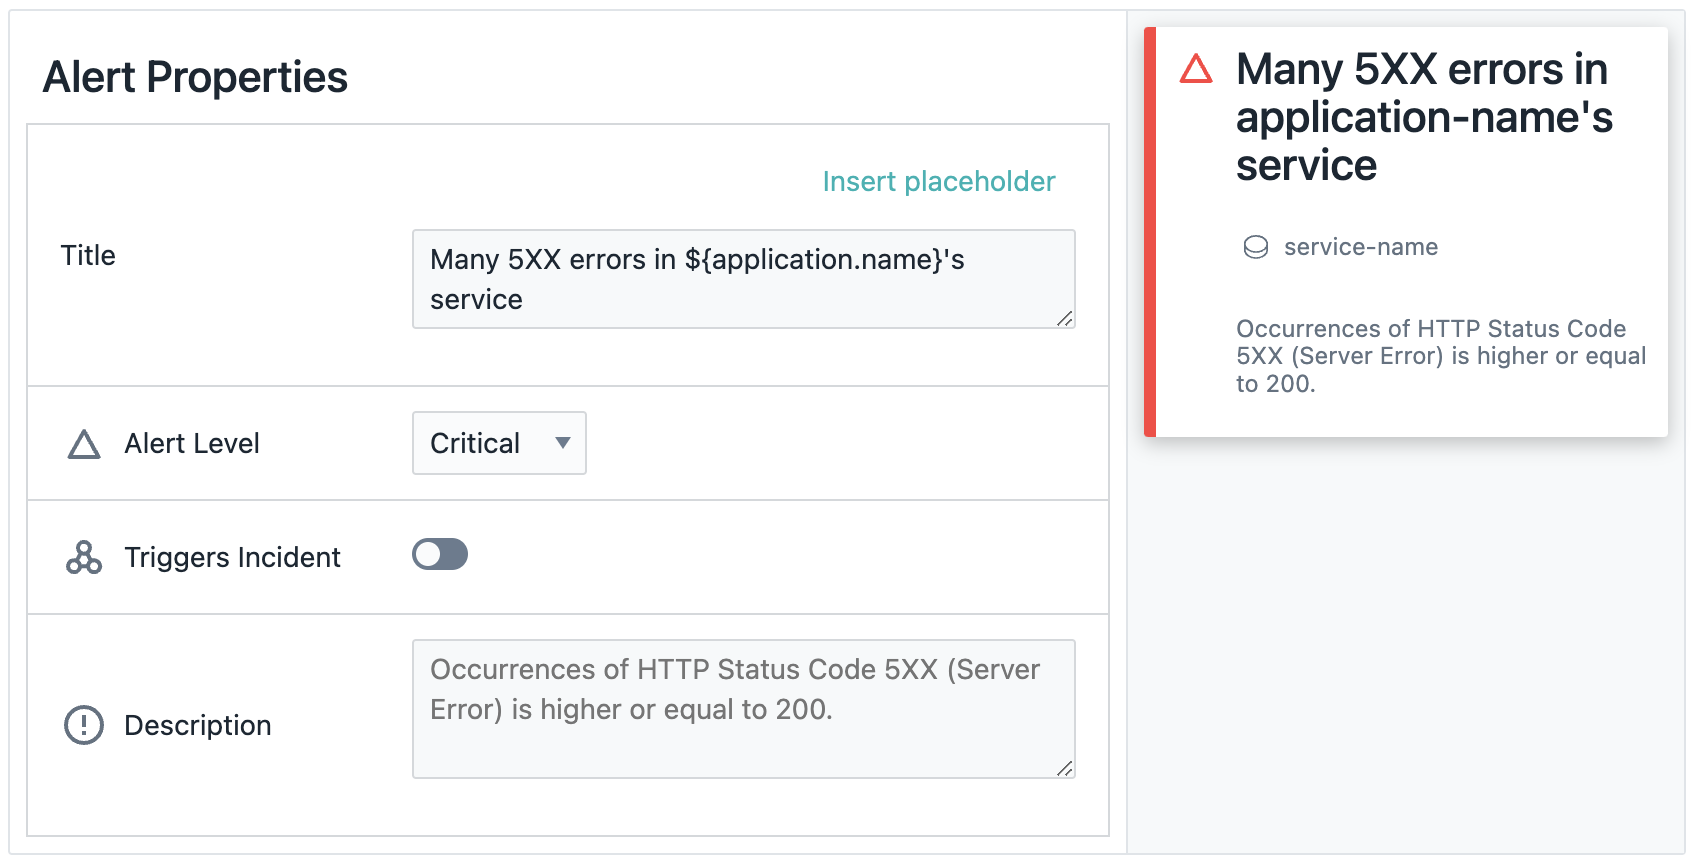
Title
Instana suggests a default title based on the used blueprint type and related configuration options. However, you can override the default title with custom static text or use a dynamic title by inserting placeholders.
For example, when you choose individual alerts per service for this application perspective, ${application.name} and ${service.name} are available, but not ${endpoint.name}. This limitation exists because alerts are scoped to individual services, allowing references to a single application perspective and service name, but not to specific endpoint names, which might vary across services.
Additionally, you can include ${severity} as a placeholder in the alert title to indicate the severity level.
Triggers incident
Enabling this toggle additionally creates an Incident to which this issue is referenced as the triggering event and other events related to this incident are referenced as related events.
Description
Optionally, add a description to the alert. A good description includes a short summary of this alert and steps to act when the alert is received. You can also create a dynamic description by inserting placeholders, which can be selected from the Insert placeholder dropdown.
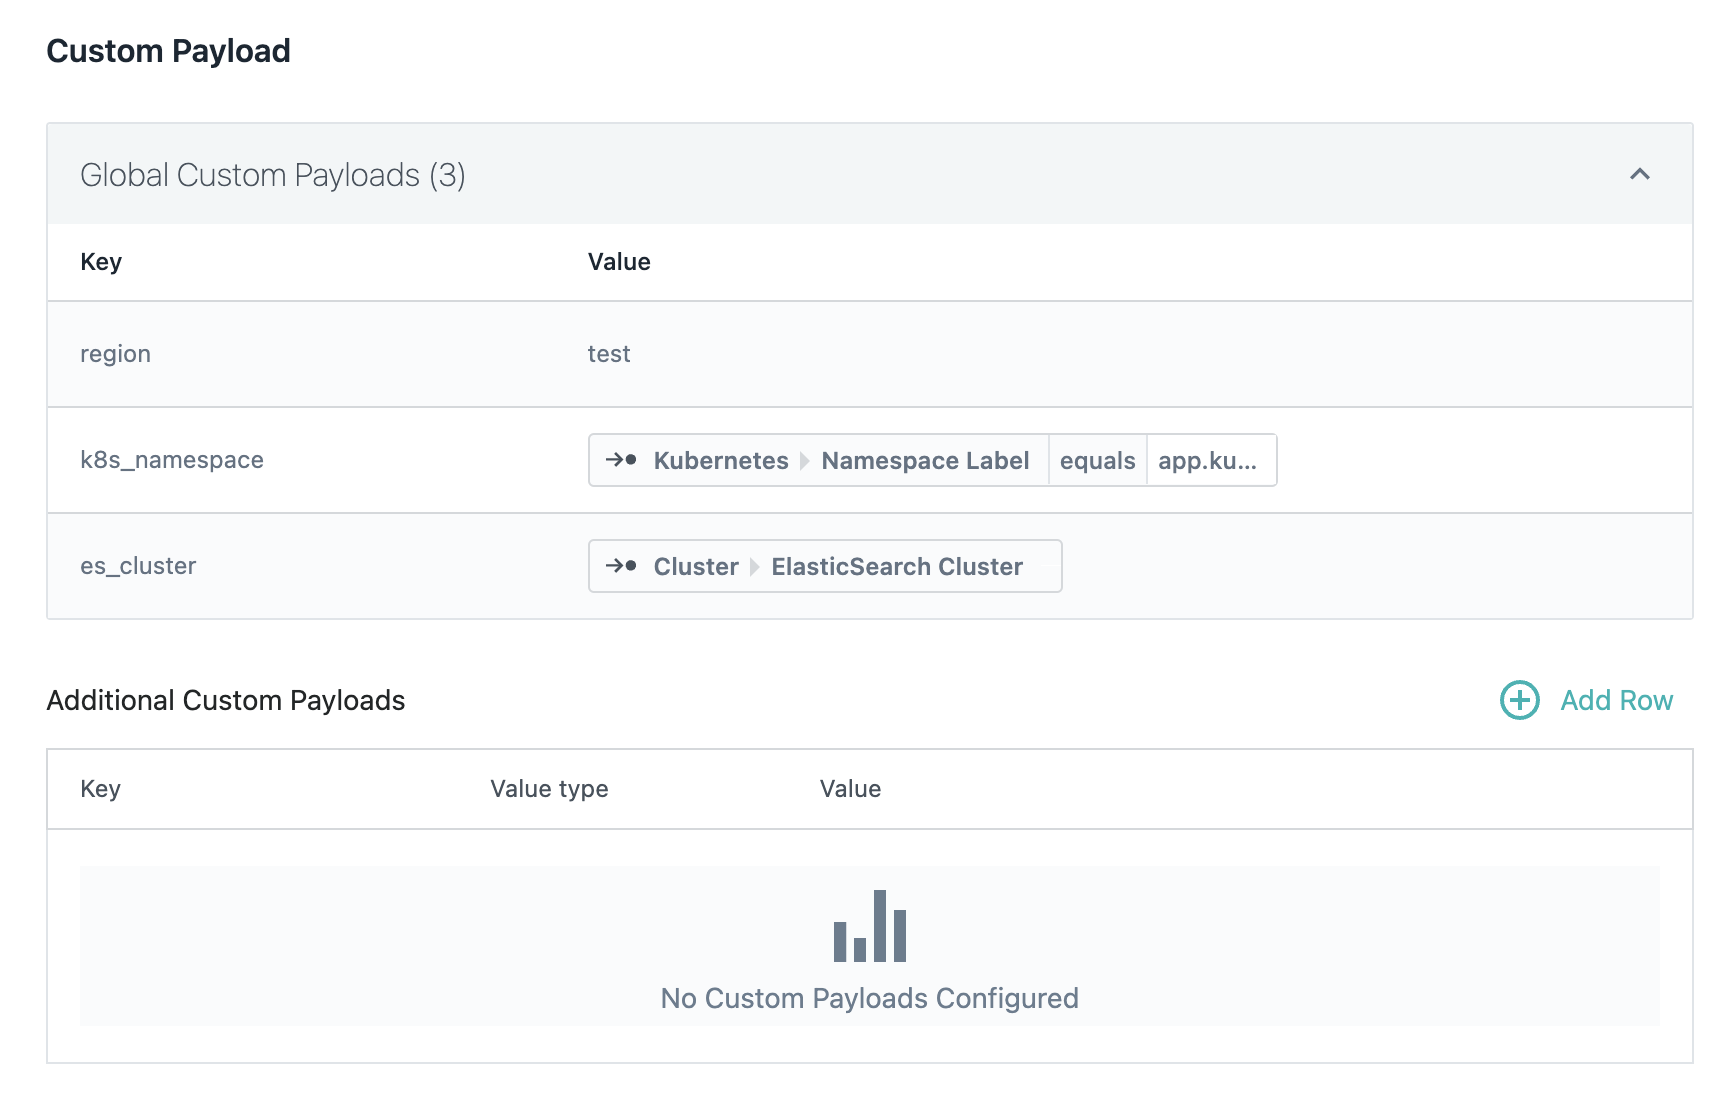
Custom payloads
Optionally, you can add custom payloads as key-value pairs, which are attached to each alert notification that is sent by Instana. To include such additional payload, click Add Row in the Custom Payloads section.
Both global custom payload and alert-specific custom payload are included in alert notifications if applicable, but the alert-specific configuration has priority over the global configuration. As a result, in the case of using the same key, the value of the global custom payload field is overridden by the alert-specific one.
You can see the globally defined custom payloads that are effectively used in the alert configuration as follows:
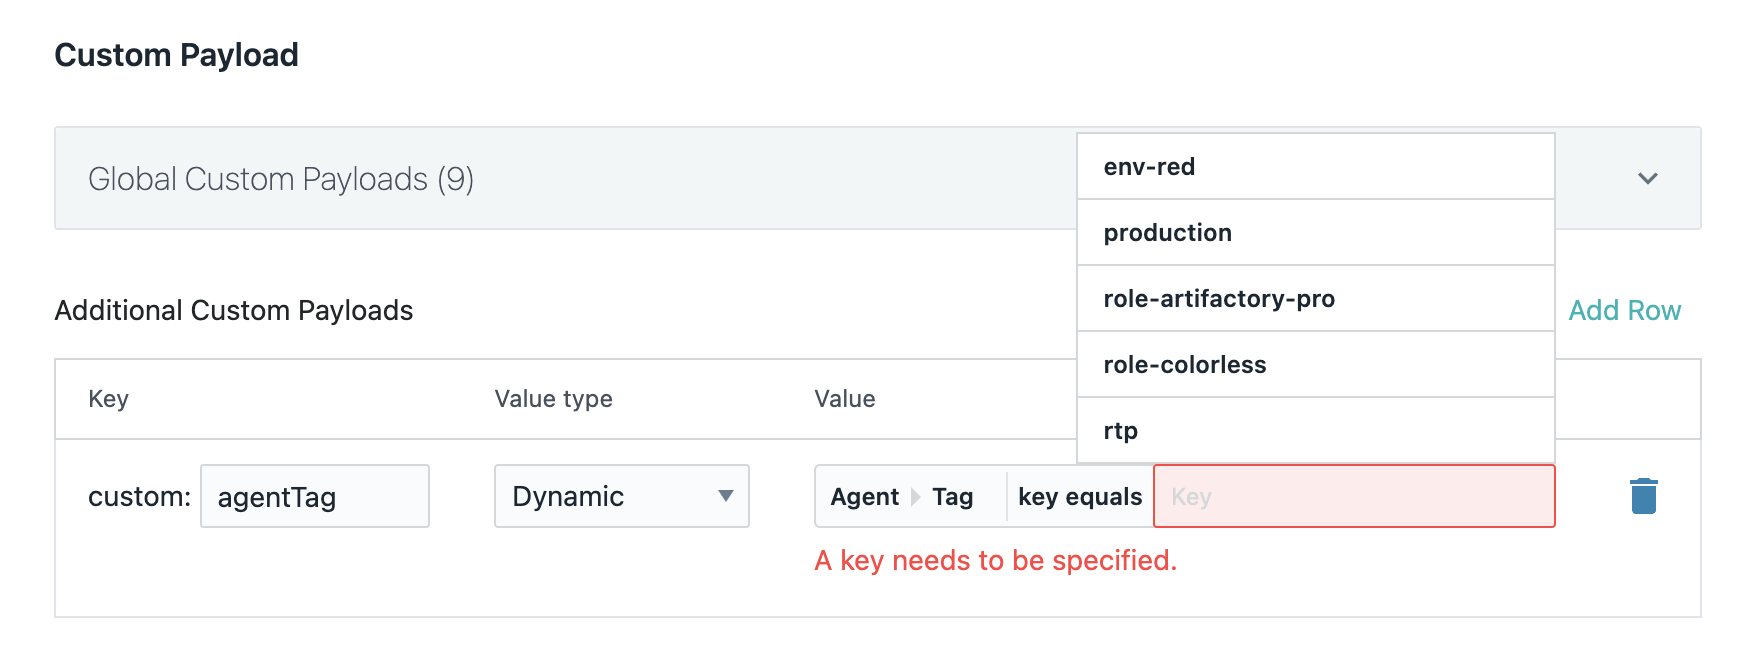
Dynamic custom payload fields in alert-specific configuration are also supported.
Select Dynamic Tag as follows:
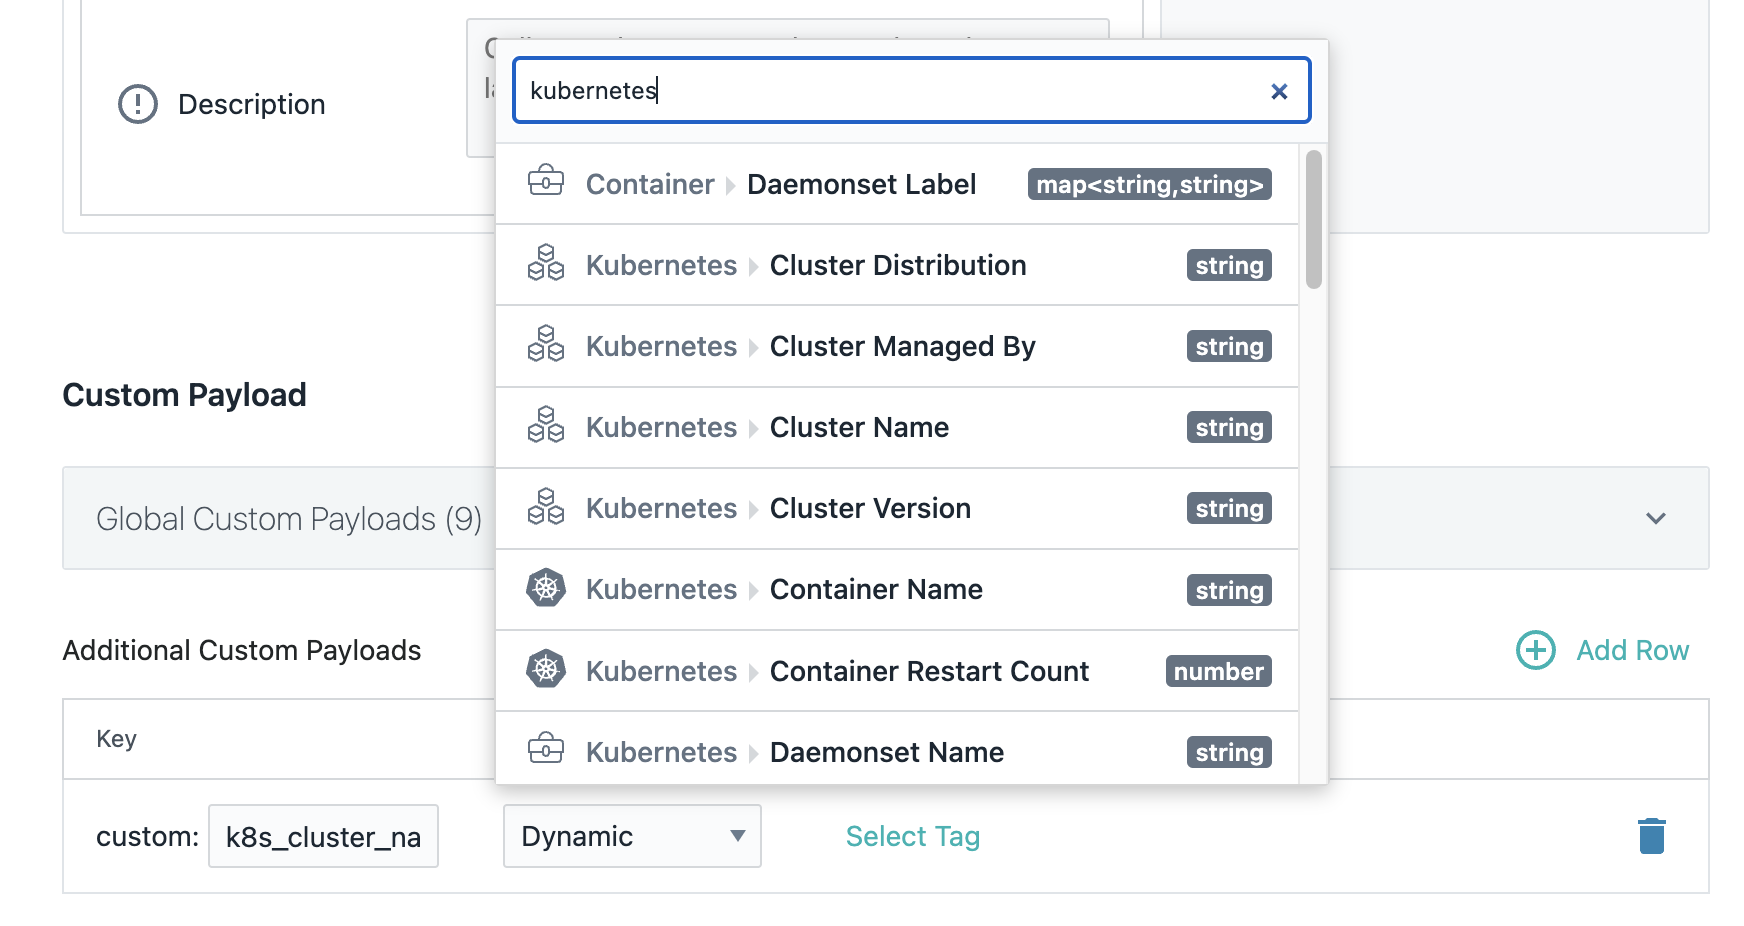
You can use the suggestions to select the right key for the selected dynamic tag or add it manually.
Global Smart Alerts
Global Smart Alerts help to simplify basic alerting use cases where a single alerting definition needs to be applied to a wider set of applications. In a nutshell, this allows you to manage your alerting from a single alert configuration, instead of multiple similar alert configurations.
Adding a Global Smart Alert
- On the sidebar, click Applications.
- Click + Add.
- Select Add Global Smart Alert
canConfigureGlobalAlertConfigs permission is required.Configuration
In general, the configuration options and steps are the same as for an (individual) Smart Alert. However, there are a few differences that are described as follows:
The alert configuration can be assigned to multiple instead of just a single application perspective. This helps you to define and apply basic alerting definitions across different applications, and still receive alert notifications scoped to each application in isolation.
- The available threshold type options are limited to
Static thresholdthat needs to be defined by you.
Discovering potential problems
Instana continuously monitors your applications, services and endpoints and provides rich monitoring dashboards that are out of the box. Smart Alerts are integrated into these dashboards and highlights potential problems in a swim lane following the charts of key performance KPIs, such as throughput, error rate and latency.
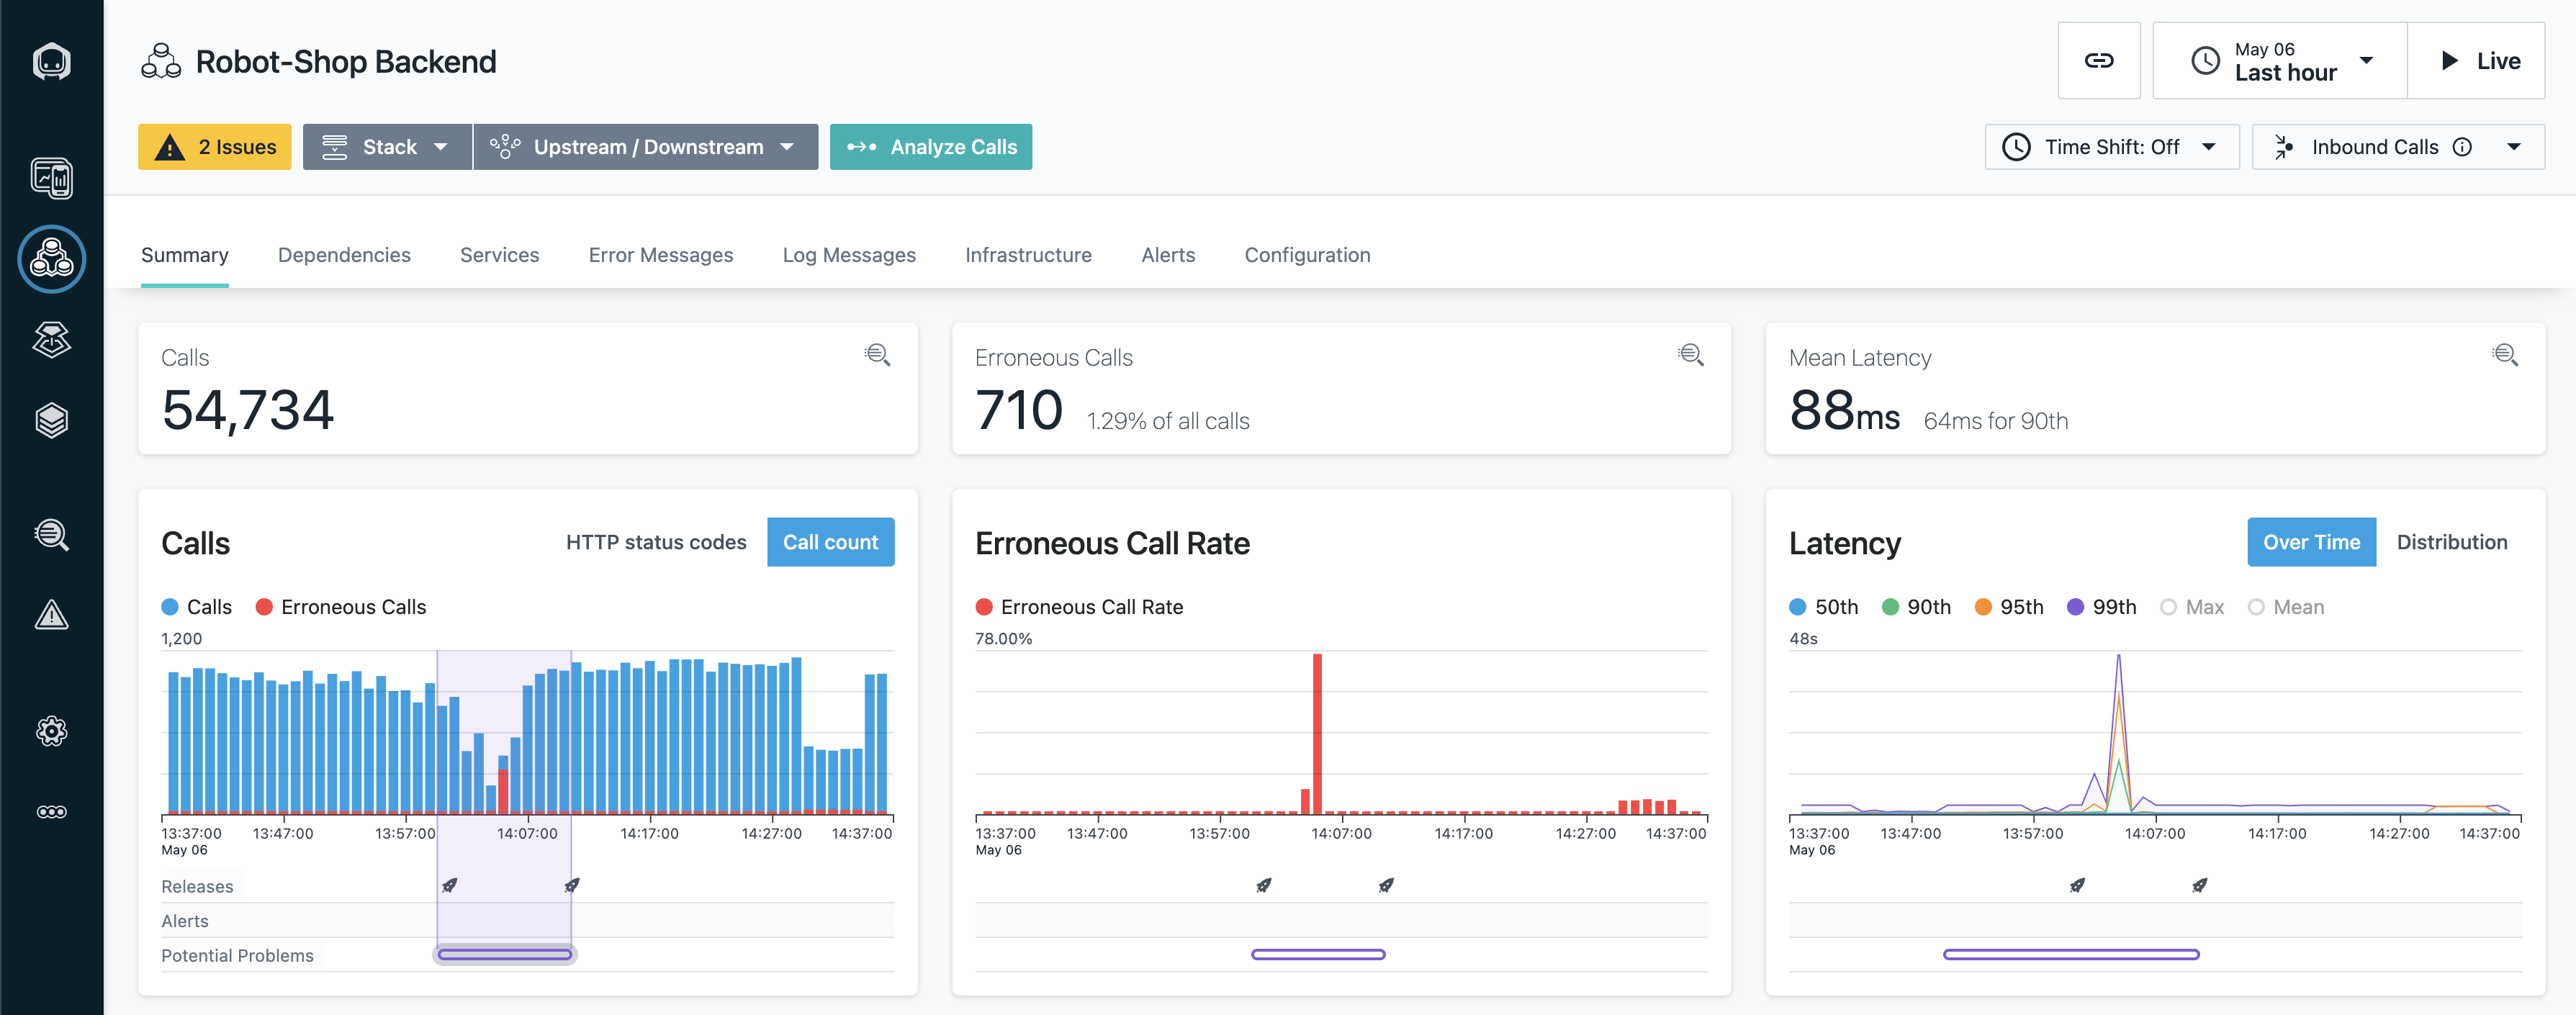
When a potential problem is discovered, you click on the respective swim lane item to reveal further details.
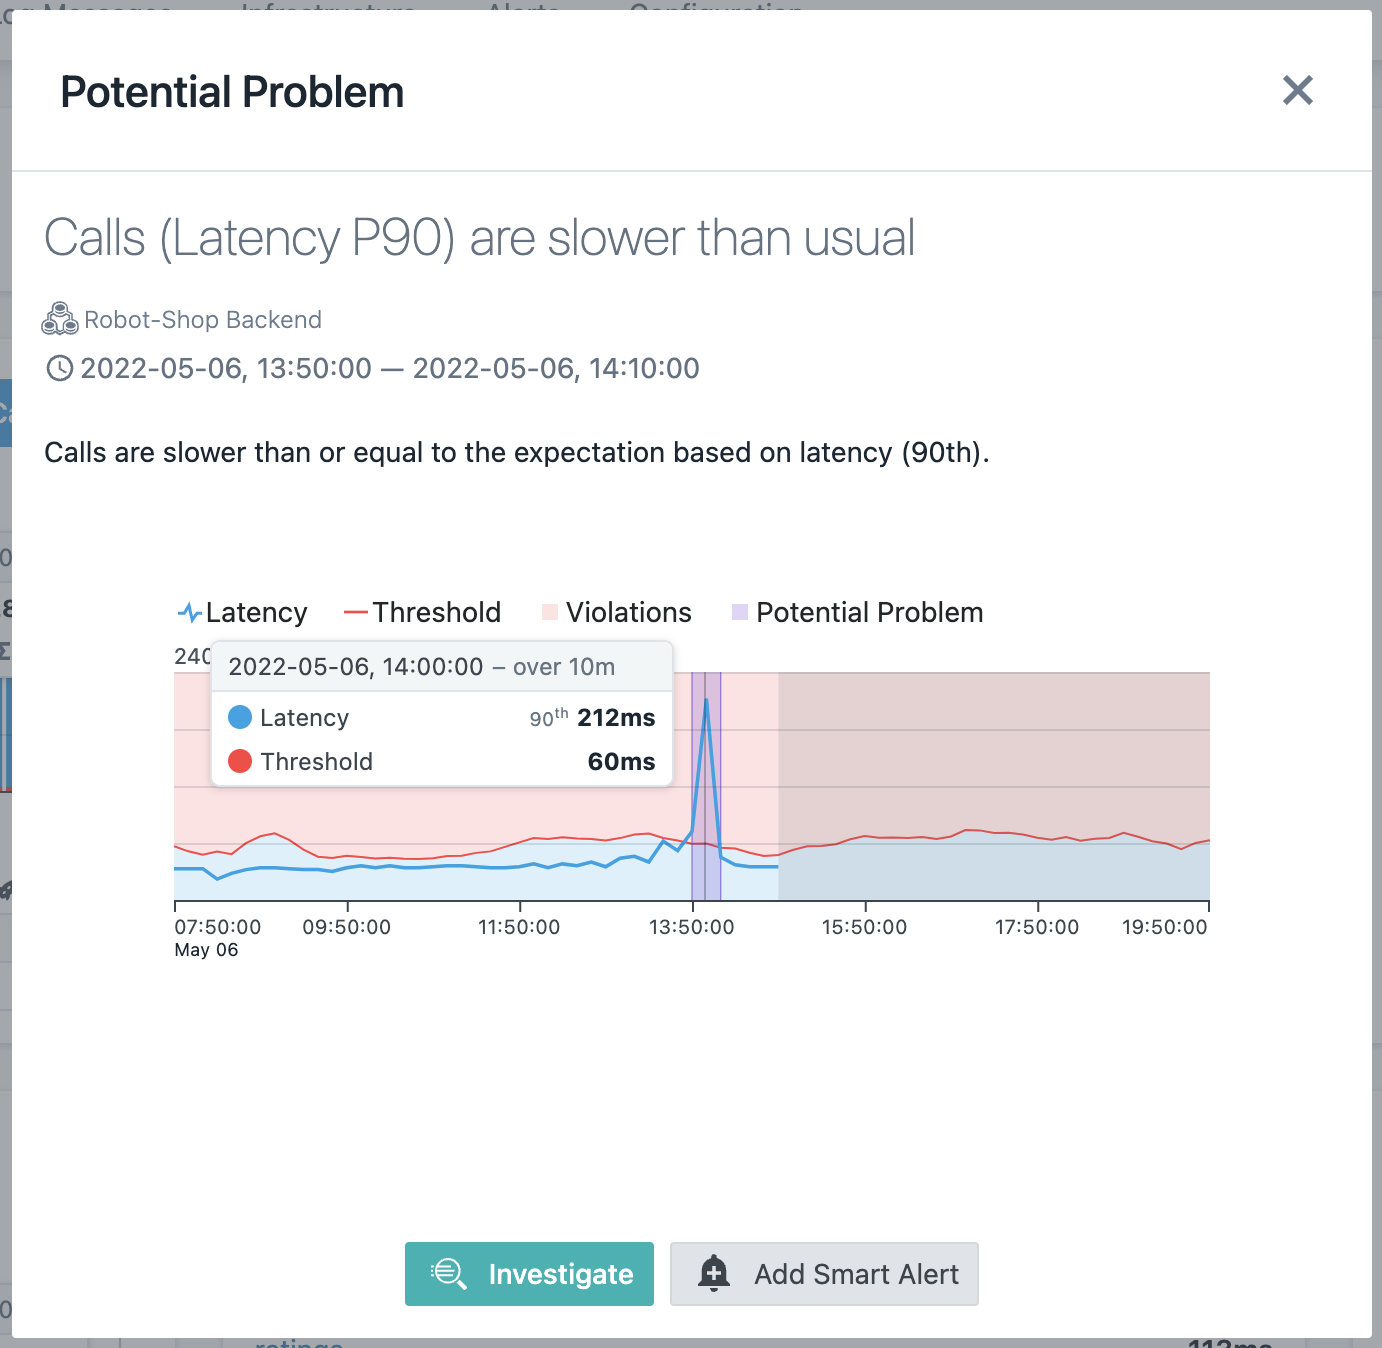
From this dialog, you can either start to investigate the problem right away by using Unbounded Analytics, or add Smart Alert to get notified the next time such a problem is observed.
Impacted users
The Impacted Users feature for application Smart Alerts helps identify widespread performance issues by tracking how many users experience a certain condition. Currently, this feature is supported only for application Smart Alerts with the scope "For this application perspective".
For each issue created by an application Smart Alert, you can now see the following details:
-
Total impacted users: The total number of users impacted while using websites or mobile apps under the application perspective. This count is measured from the time the alert is triggered until either the current time or the issue closing time, whichever occurs first. An Impacted User refers to any user who experiences a call that violates the alert criteria. For example, if a Smart Alert is configured for call durations greater than 500 ms, an impacted user is any individual who experiences a call with a duration greater than the 500 ms threshold. The user in this case is the user that is identified in the website or mobile agent. If no user is logged in, the session ID is used to identify the impacted user. For more information, see Identifying users.
-
Total users: The total number of users that were using the websites or mobile applications under the application perspective. This tracking starts from the time that the alert is triggered until either the current time or the issue closing time, whichever occurs first.
-
Table: A table displays the number of impacted users per website or mobile application. The table lists all the websites and mobile applications with at least one impacted user and provides the count of impacted users per each application.
Note: The sum of the counts in the table rows might exceed the total number of impacted users because a single user might access multiple websites or mobile applications.Figure 3. Impacted users table 
- Impact report: A detailed report shows the specific user IDs impacted for each website or mobile application. This report shows a more detailed breakdown of the impacted users with each record in the table, represents a unique user per website or mobile application. For each user, the report includes their name, email address, country, subdivision, Config Label (website or mobile application name where the user was impacted), and source (web or mobile application) if reported by the agent.

Impacted user information is available only for the past 7 days. For more information, see [IBM data retention policy](../policies/index.html#data-retention-policy).
{: note}
Terraform Support
Instana enables Infrastructure as Code (IaC) capabilities by providing a Terraform resource for managing Application Smart Alerts programmatically. This capability allows DevOps and SRE teams to define, deploy, and maintain alert configurations as code. It helps improve automation and consistency across environments.
For more information about managing Application Smart Alerts by using Terraform, see the official Terraform resource documentation:
FAQ
How is scoping using the tag-based Query Builder in Smart Alerts different from Dynamic Focus in Custom Events?
In Instana's Custom Events for application, service and endpoint entities, you could define the scope using Dynamic Focus Query (DFQ). In a nutshell, you can consider DFQ as a query language to select entities, such as a set of services. And these selected entities are then considered by the defined Custom Event rule. As an example, when the entity type Service is used, the DFQ scope entity.host.fqdn:gke-* will apply the rule on all service entities that are provided by any of the GKE hosts. Furthermore, note that metrics from the entire auto-discovered services in scope are used, even though these services might be in context of several Application Perspectives (AP). In other words, Custom Events on both Service and Endpoint entities does not respect the AP-context. For more information about how Instana automatically discovers services and endpoints, see Monitoring Applications docs.
In contrast, the tag-based Query Builder that are used in Smart Alerts or Unbound Analytics enables filtering on attributes of each individual call. Consequently, it allows to select Application Perspective (AP) entities directly by using tags such as service.name or endpoint.id, or indirectly by using related infrastructure tags such as host.fqdn or kubernetes.namespace.name. In addition, entities can also be included only partially by e.g. excluding specific endpoints from a service, or by narrowing down the scope of calls to a specific type such as HTTP by using the call.type tag filter. And because a Smart Alert is always implicitly associated to an Application Perspective by using application.id, all metrics that are respected by the rule are always in context of that AP.
Moreover, each Smart Alert is always in context of an Application Perspective, which also can define filters on call attributes as part of the AP configuration. As a result, you can see that each service and endpoint that are owned by the AP might show different metrics in its Service Dashboard compared to the corresponding dashboard of the (entire) auto-discovered service. Only an AP that does not define any tag filter and therefore matches to every single call owns services and endpoints that are comparable to Service Dashboard or Endpoint Dashboard without any AP context. One example for such an Application Perspective is the default All Services AP.
How to migrate a Custom Event on Application, Service or Endpoint metrics to Smart Alerts?
Due to the fact that both Smart Alerts and Custom Events are conceptually different, especially scoping, there is not always a trivial one-to-one mapping between Smart Alerts and Custom Events. Furthermore, some capabilities that are supported in Smart Alerts are not supported in Custom Events , such as the follows:
- Always respect the context of an Application Perspective by default.
- Define filters on the raw underlying calls instead of being limited to select entities only.
- The ability to directly assign alert-channels.
- Include the respective application, service or endpoint name in the alert title. For some of the capabilities, workarounds are available, such as creating duplicated Custom Events or APs. Converting custom events one-by-one to a similar Smart Alert might be possible, but you can consider applying the existing workarounds instead of creating new Smart Alerts.
Semi-automatic migration
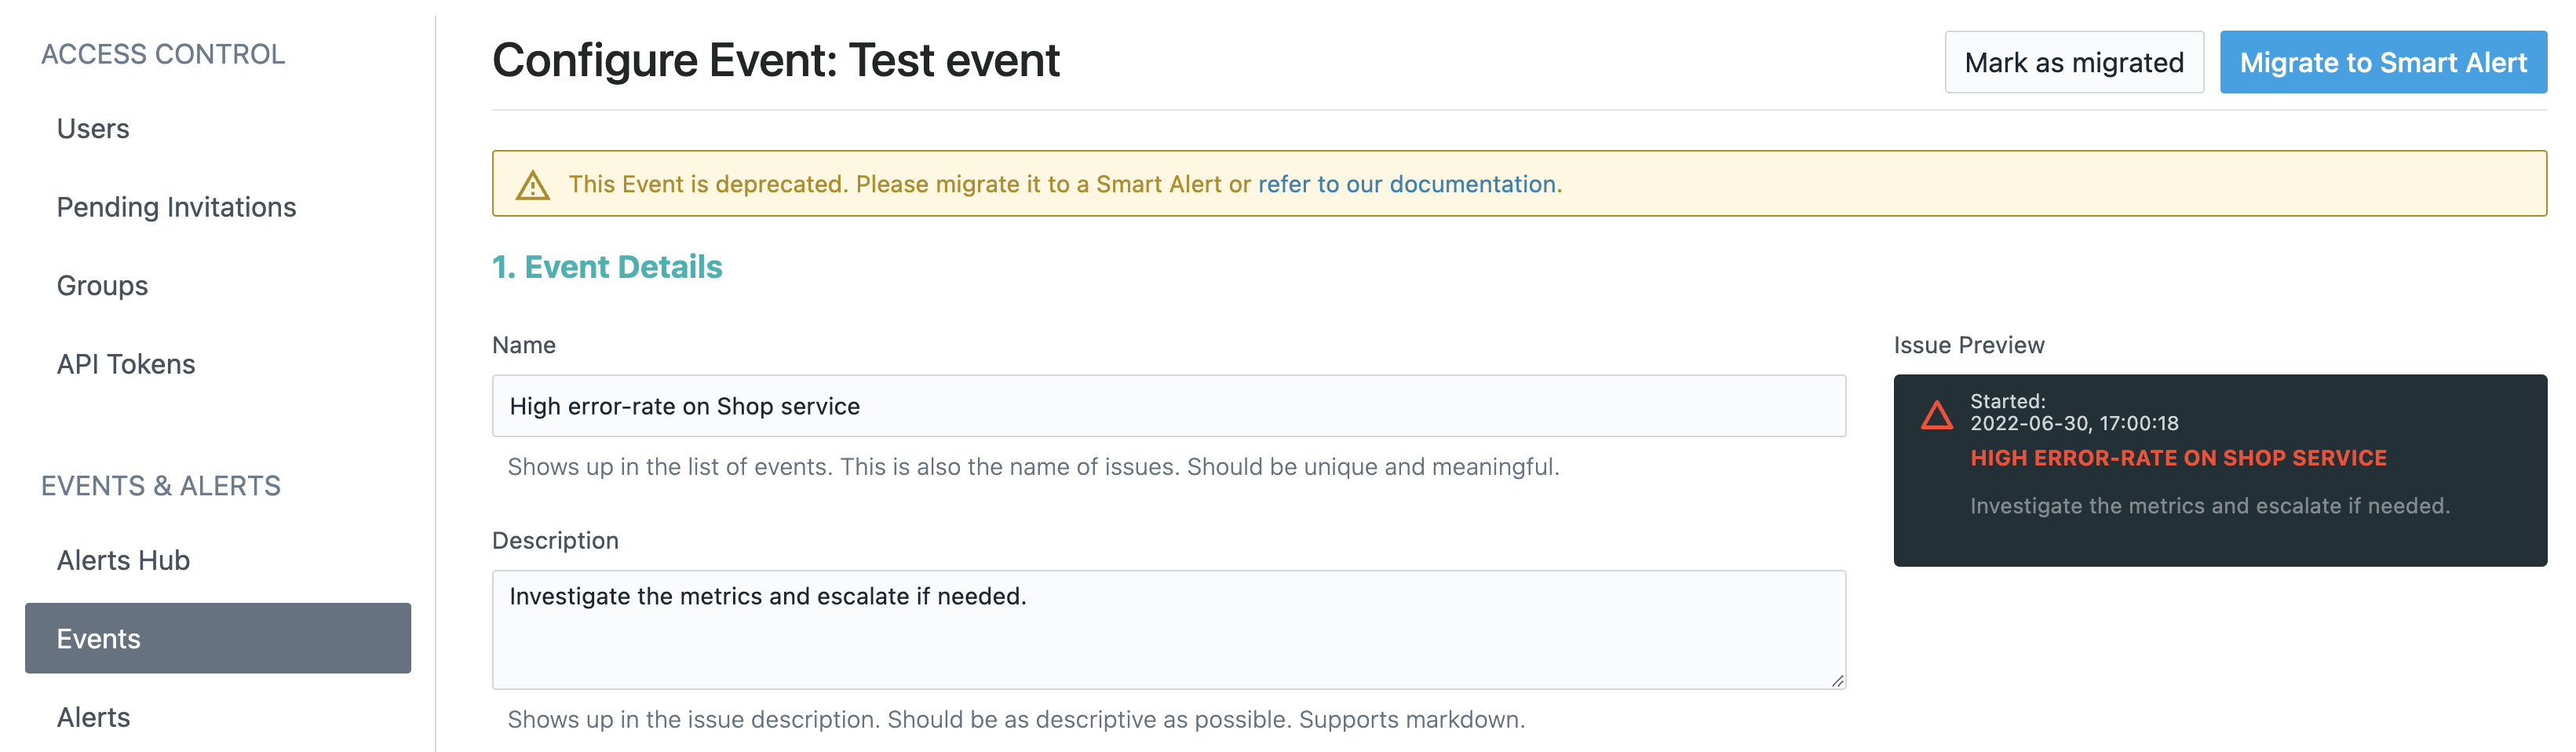
However, to help you with the migration of existing Custom Events to Smart Alerts, the Instana UI provides basic migration tooling. The details page of a Custom Event on an Application, Service or Endpoint entity shows two buttons that are related to the Smart Alert migration:
- Mark as migrated: Marks a deprecated Custom Event as migrated and disables it. This is useful in case you manually migrated this Custom Event to a Smart Alert. After marking it as migrated, you will still be able to view it in the list, and review its configuration anytime in the future for reference. This is not the case if you delete this configuration instead. Furthermore, this function helps to track the migration progress, and to ensure that no Custom Event gets migrated more than once.
- Migrate to Smart Alert: Opens the Smart Alert dialog with the values of respective fields, including name, description, severity, incident, entity-type, metric, evaluation granularity, aggregation, operator and threshold. Though fields in Custom Events can't always be mapped to fields in Smart Alerts, Instana will try to migrate these fields from Custom Events to Smart Alerts on best efforts. In addition, the scope of the DFQ or selected Applications Perspectives is taken over by selecting the respective entities either explicitly or by using Query Builder tag filters. Note that some Dynamic Focus Queries can only be mapped partially or not mapped at all to either entity selection or Query Builder tag filters. You will see the respective warning message in these cases. If DFQ cannot be fully mapped by the migration tool, you can refer to Entity type mapping and scope selection to manually select the scope of Smart Alert. Saving that Smart Alert will then automatically disable the previous Custom Event and mark it as migrated.
Manual migration
You can manually migrate custom events to Smart Alerts.
Metric to blueprint mapping
| Metric Name | Blueprint |
|---|---|
| Calls/s | Throughput |
| Erroneous Call Rate | Erroneous Calls with the metric Error Rate selected in the Threshold section of the Smart Alert creation or editing wizard |
| Erroneous Calls/s | Erroneous Calls with the metric Error Count selected in the Threshold section of the Smart Alert creation or editing wizard |
| Calls Min/Avg/Max Latency, Calls Latency Nth | Slow Calls; with the respective aggregation selected |
Entity type mapping and scope selection
An important option to set right is the scope of individual alerts. This defines whether the alerts are scoped to the whole application, or individually for each service or endpoint in context of it. Effectively, you can compare the scoping with the grouping functionality in Unbound Analytics (UA), which group by application.id, service.id or endpoint.id. The following screenshot uses service.name as an example for better readability.
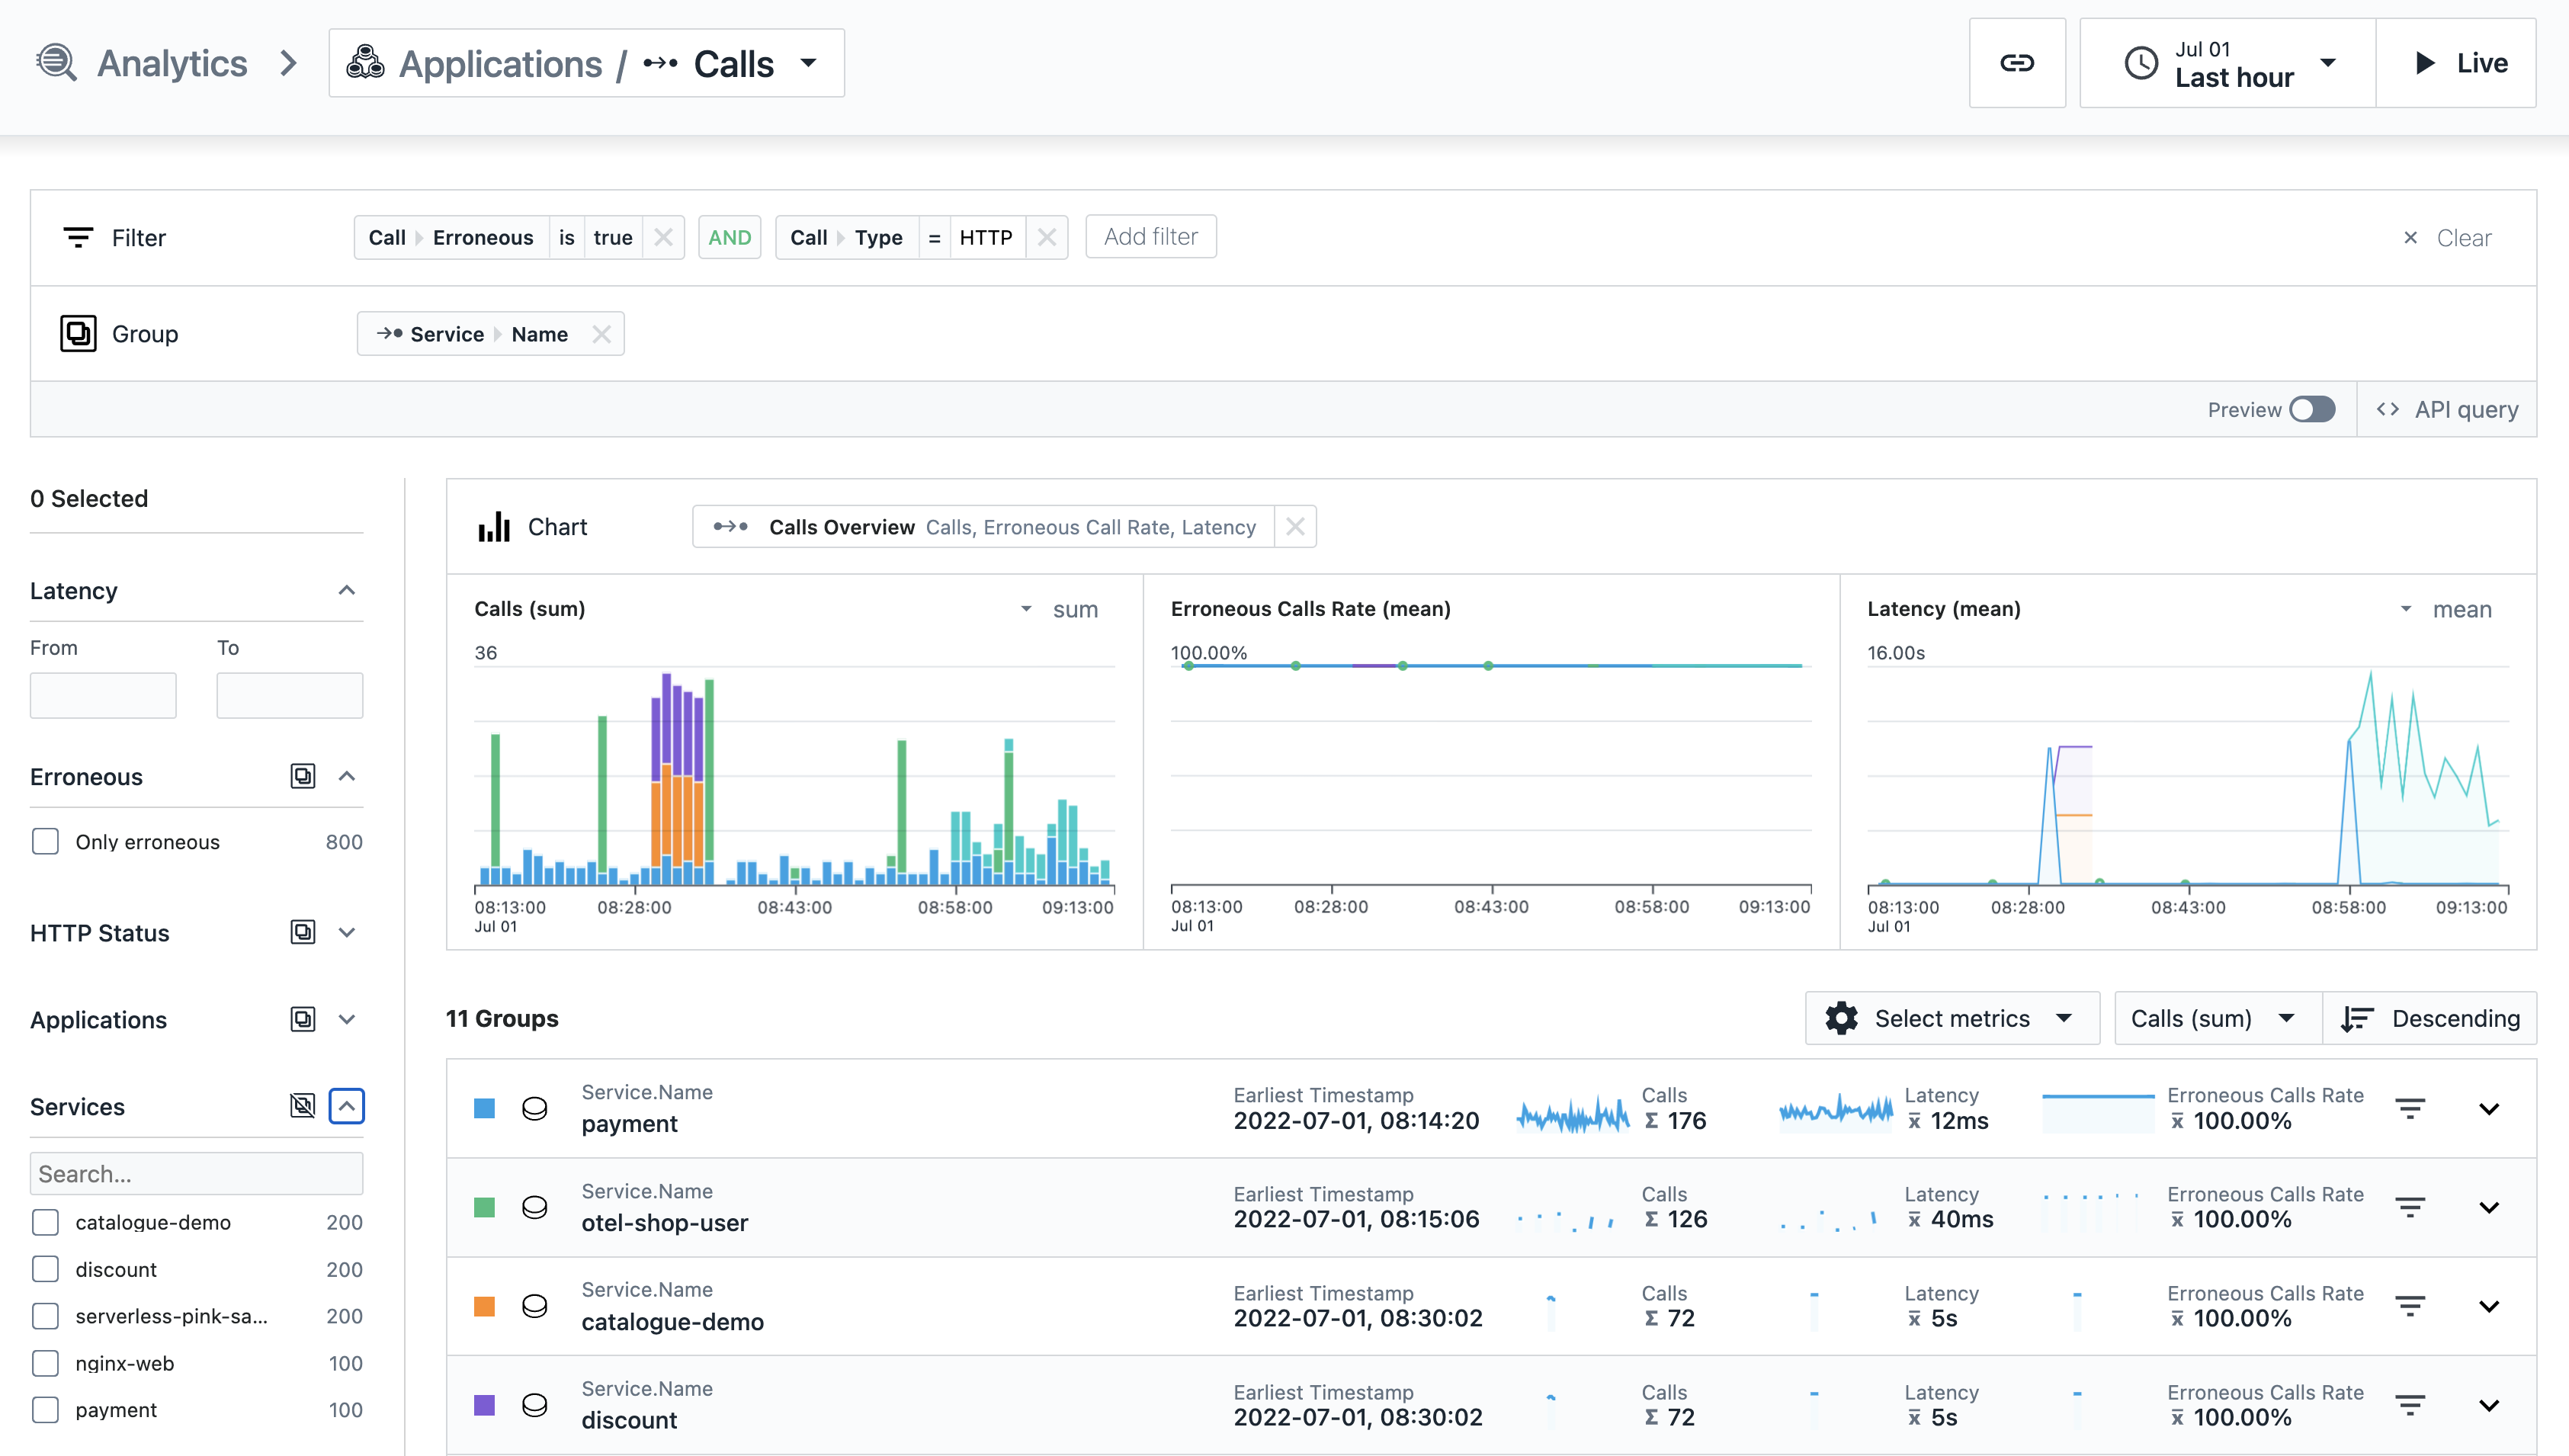
Consequently, to better understand which services are in scope for a given DFQ, enter a similar query in UA by using the corresponding grouping of the previously defined Entity Type in the Custom Event to migrate. As shown in the figure previously, the output then lists all services that have been in scope of the Custom Events. And then this selection can be taken over to the service selection of your Smart Alert.
Inbound calls or all calls mapping
To correctly choose between inbound calls only or all calls, you only need to check for the metric used in the Custom Event to migrate.
Only the entity type Application offers metrics on Inbound Calls in Custom Events. As a result, both Service and Endpoint entity always needs to be migrated by using the All Calls option so that they have the most similar behavior of matching the same calls after migration.
Internal and Synthetic calls mapping
In Custom Events, both internal and Synthetic calls have not been included in the KPIs of each application, service or endpoint. In line with this, these two configuration options need to be kept unchecked when the most similar behavior is desired.
Mapping of time window, window size and threshold value
In Custom Events, the applied windowing function of the rule depends on the selected metric:
- Time Window: The used operator is applied on the non-percentile metric in 1 second granularity in a sliding window fashion. As an example, the
avgaggregated metric of a 10-minute time window consists of up to 600 individual metric samples, and the aggregated metric value is defined by sum of all metric samples, which are divided by the number of samples. - Window Size: For percentile metrics such as the All Calls Latency 90th, Instana provided precomputed rollup values for various percentile metrics that can be used in Custom Events. No sliding window is involved, and the aggregation is implicitly defined by the pre-computed metric. Instead, the threshold value is compared to an individual rollup value.
In Smart Alerts, the granularity of the metric can be defined by using the Evaluation Granularity. This option is more like the Window Size that are used in Custom Events than the Time Window. No sliding window is involved, which has the advantage that the aggregated metric values can be compared with any of the dashboards in Instana's application monitoring. Metrics are not pre-computed, but are derived individually depending on the used tag filters. This enables you scope your alert to exactly what you care about. In addition, the available Time Threshold options give you further control compared to Window Size in Custom Events with respect to how often an individual evaluation needs to be considered as a violation of the rule in sequence.
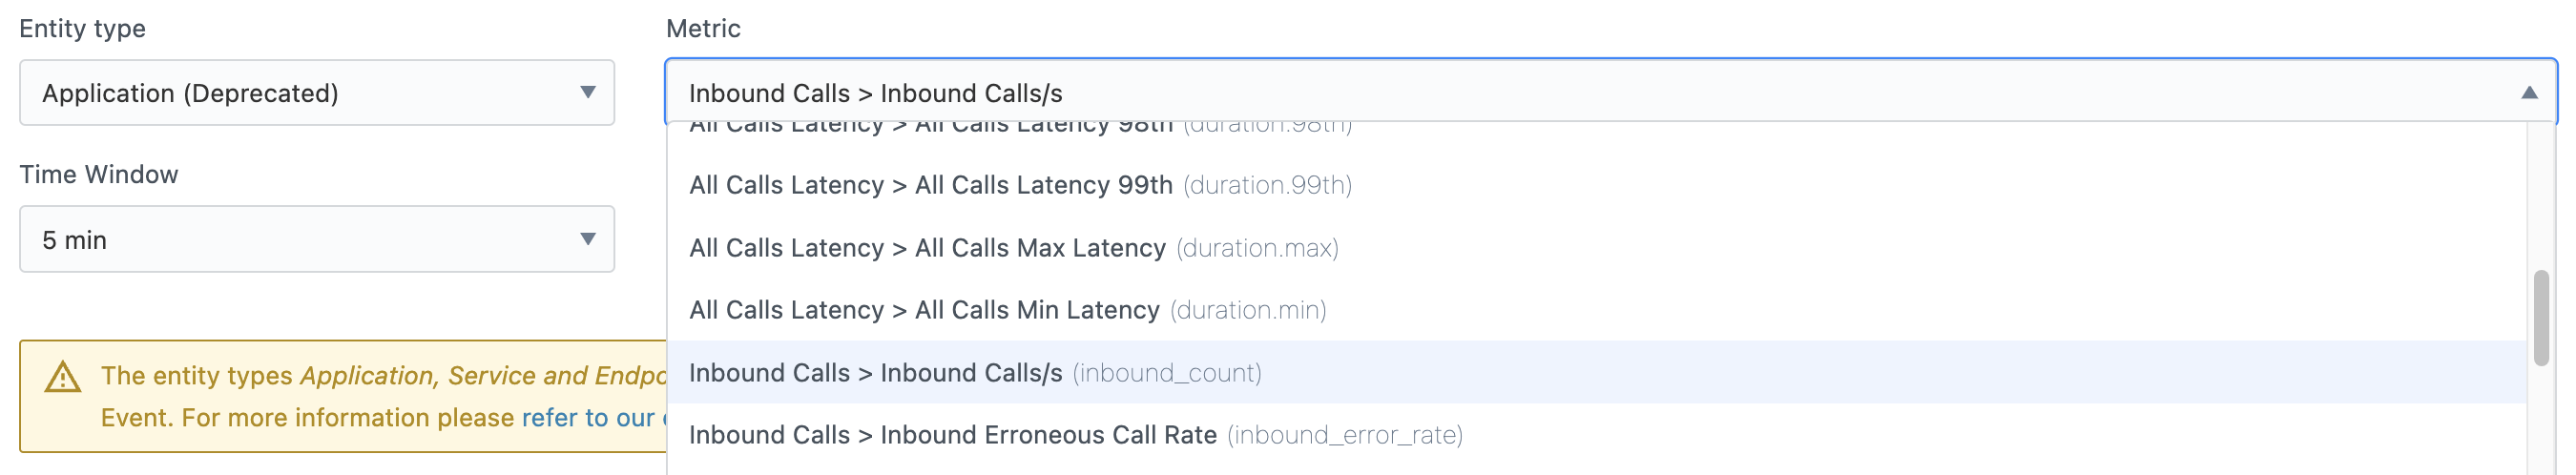
When you migrate a Custom Event to a Smart Alert, keep in mind that the threshold value needs to be adjusted accordingly. This might be due to changes in the timeframe that are used for the aggregation, because of a different normalization applied to the metric, or due to the applied AP context in every Smart Alert. As an example, consider the following Custom Event condition configuration on an entity of type Application:
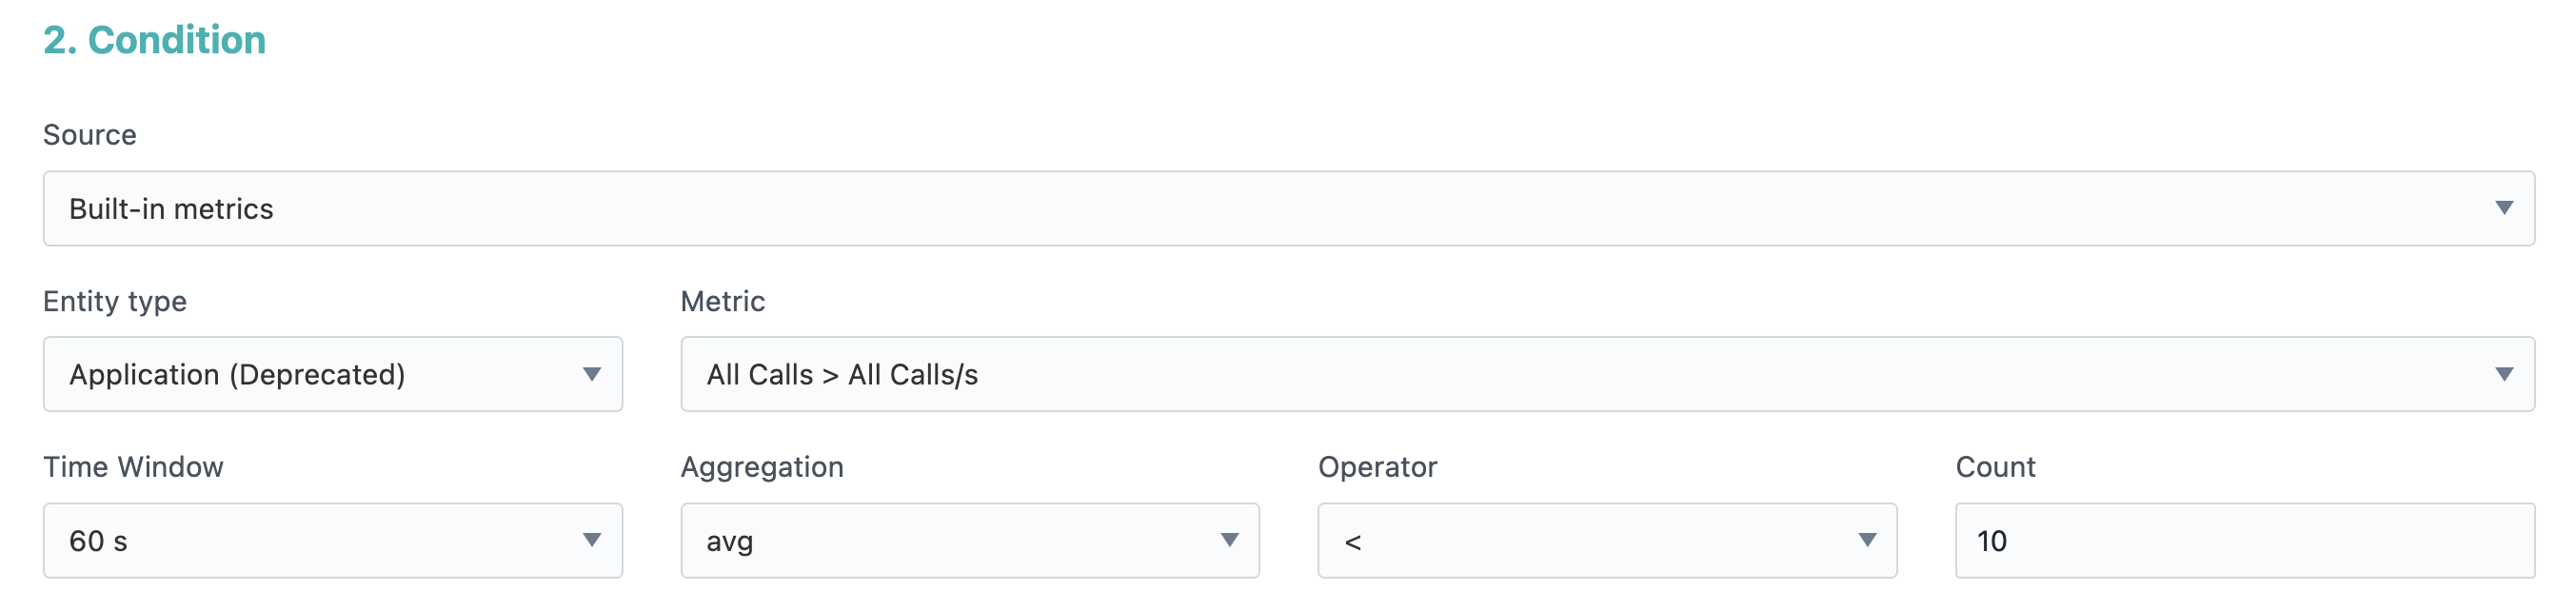
The rule defines a sliding window on up to 60 All Calls/s values on per second granularity by using avg aggregation. And the rule is considered as violated when the aggregated value is less than the threshold of 10 calls per second on average.
When you create an equivalent Smart Alert by using the 5-minute Evaluation Granularity option, the threshold needs to be adjusted accordingly, because the metric scale is no longer normalized to per-second values. Consequently, the threshold needs to be set to 3000 calls per 5-minute timeframe.
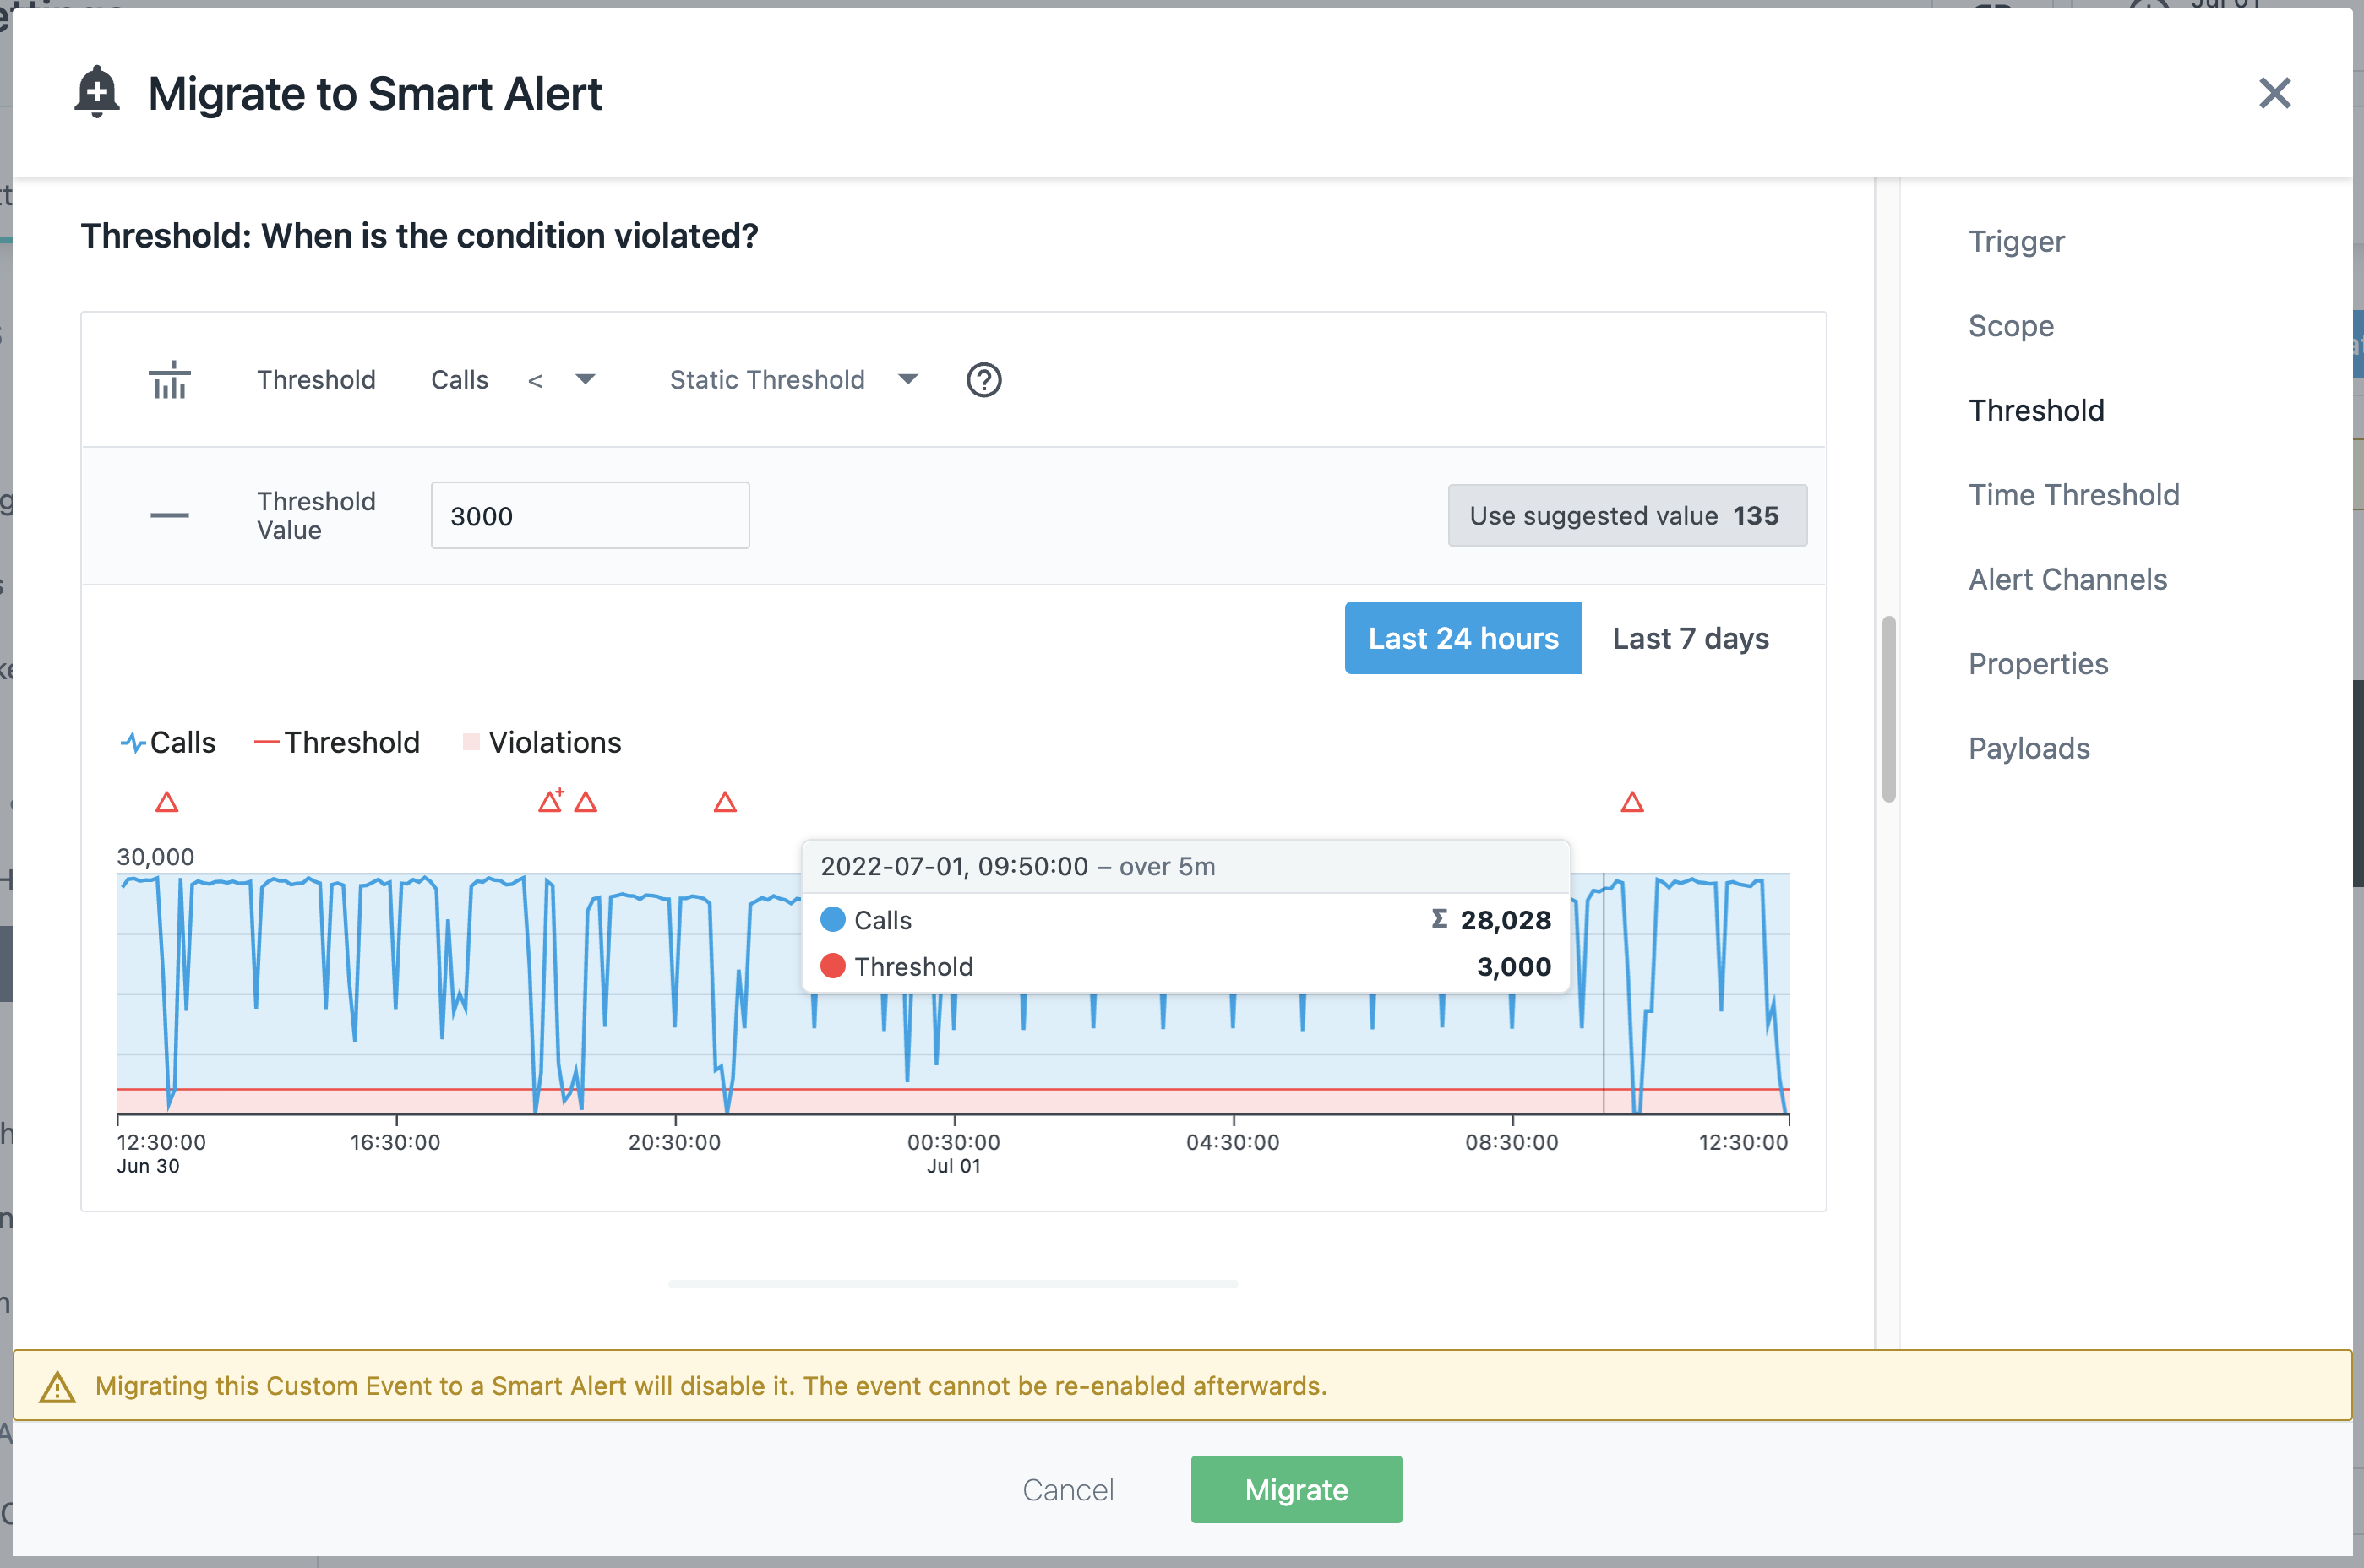
The Smart Alert dialog's preview chart helps you to set the right threshold value by comparing it with historic data of the last day or week.
How is time threshold in Smart Alerts related to the grace period in custom events?
In Smart Alerts, you no longer need to set the grace period manually. The grace period of a Custom Event was previously used to compensate against the highly fluctuating metrics on per-second granularity, and to make up for gaps or a temporary recovery of the metric. All of these can lead to effects such as intermediate event resolution and therefore the creation of redundant events.
In Smart Alerts, the underlying metric is typically more stable due to the larger metric granularity that is used for its aggregations. In addition, further control over the temporal creation and resolution behavior of the alert can be defined by using the options in Time Threshold section.
Why do I not see the Logs Blueprint option in my Self-Hosted Classic Edition (Docker) setup?
When we made Application Smart Alerts generally available, we kept the Logs Blueprint and the use of log related tags as public preview feature. One of the reasons why it is not enabled by default is the overall impact it has regarding query performance of application monitoring data when used extensively. Furthermore, there was a common misconception that the respective metrics would be based on the raw logs, while these are actually based on the number of parent calls. Alerting on logs, even outside error and warning logs collected by the Instana tracers, is a separate capability that will be added in the future as part of Log Monitoring. This will then replace the Logs Blueprint option in Application Smart Alerts.
However, if you want to have the Logs Blueprint option enabled in your Classic Edition or Custom Edition , then proceed as follows:
Instana Console (Classic Edition)
-
Enable the feature flag in the
settings.hclfile:... feature "smartAlertsLogsBlueprintEnabled" { enabled=true } ... -
Apply the changes via the
instana updatecommand.
Instana Operator (Kubernetes)
-
Enable the feature flag in the
core.yamlfile as follows:apiVersion: instana.io/v1beta2 kind: Core metadata: name: instana-core namespace: core spec: ... featureFlags: - name: feature.smart.alerts.logs.blueprint.enabled enabled: true ... -
Apply the changes through the
kubectl apply -f core.yamlcommand.
Why am I not able to see the impacted user information for my Smart Alert?
To see the impacted user information, you must configure websites or mobile applications and enable backend correlation by following the provided instructions. Also, the agent must either be enabled for session monitoring or use the agent API to set a valid user.