Analyze Infrastructure
Analyze Infrastructure provides an infrastructure-centric ad-hoc exploration solution that lets you perform multivariate comparison of infrastructure entities in a concise table across various customizable key metrics. You can filter and group your infrastructure entities by using any available resource attributes or tags to dynamically compare entity sets to quickly isolate the scope of infrastructure issues. Analyze Infrastructure feature is enabled by default in Instana SaaS and Self-Hosted Standard Edition. It is also enabled with Self-Hosted Custom and Classic Edition when Beeinstana is active. For more information, see Using the BeeInstana Kubernetes Operator and BeeInstana Metric Pipeline.
To start exploring by using the infrastructure entity type, go to the Unbounded Analytics view, and then select Infrastructure as follows:

View entities and metrics
Click an infrastructure entity type name to list the infrastructure entities for that type. Each infrastructure entity type displays default metrics that are relative to that type and a health signal on each entity, which allows faster issue tracking.
Infrastructure entities can be sorted by name or by metric value.

View custom metrics
You can reorder, add, or remove metrics by using the Select metrics drop-down menu.
-
Click the Select Metrics drop-down menu.

-
Select the metric to add.
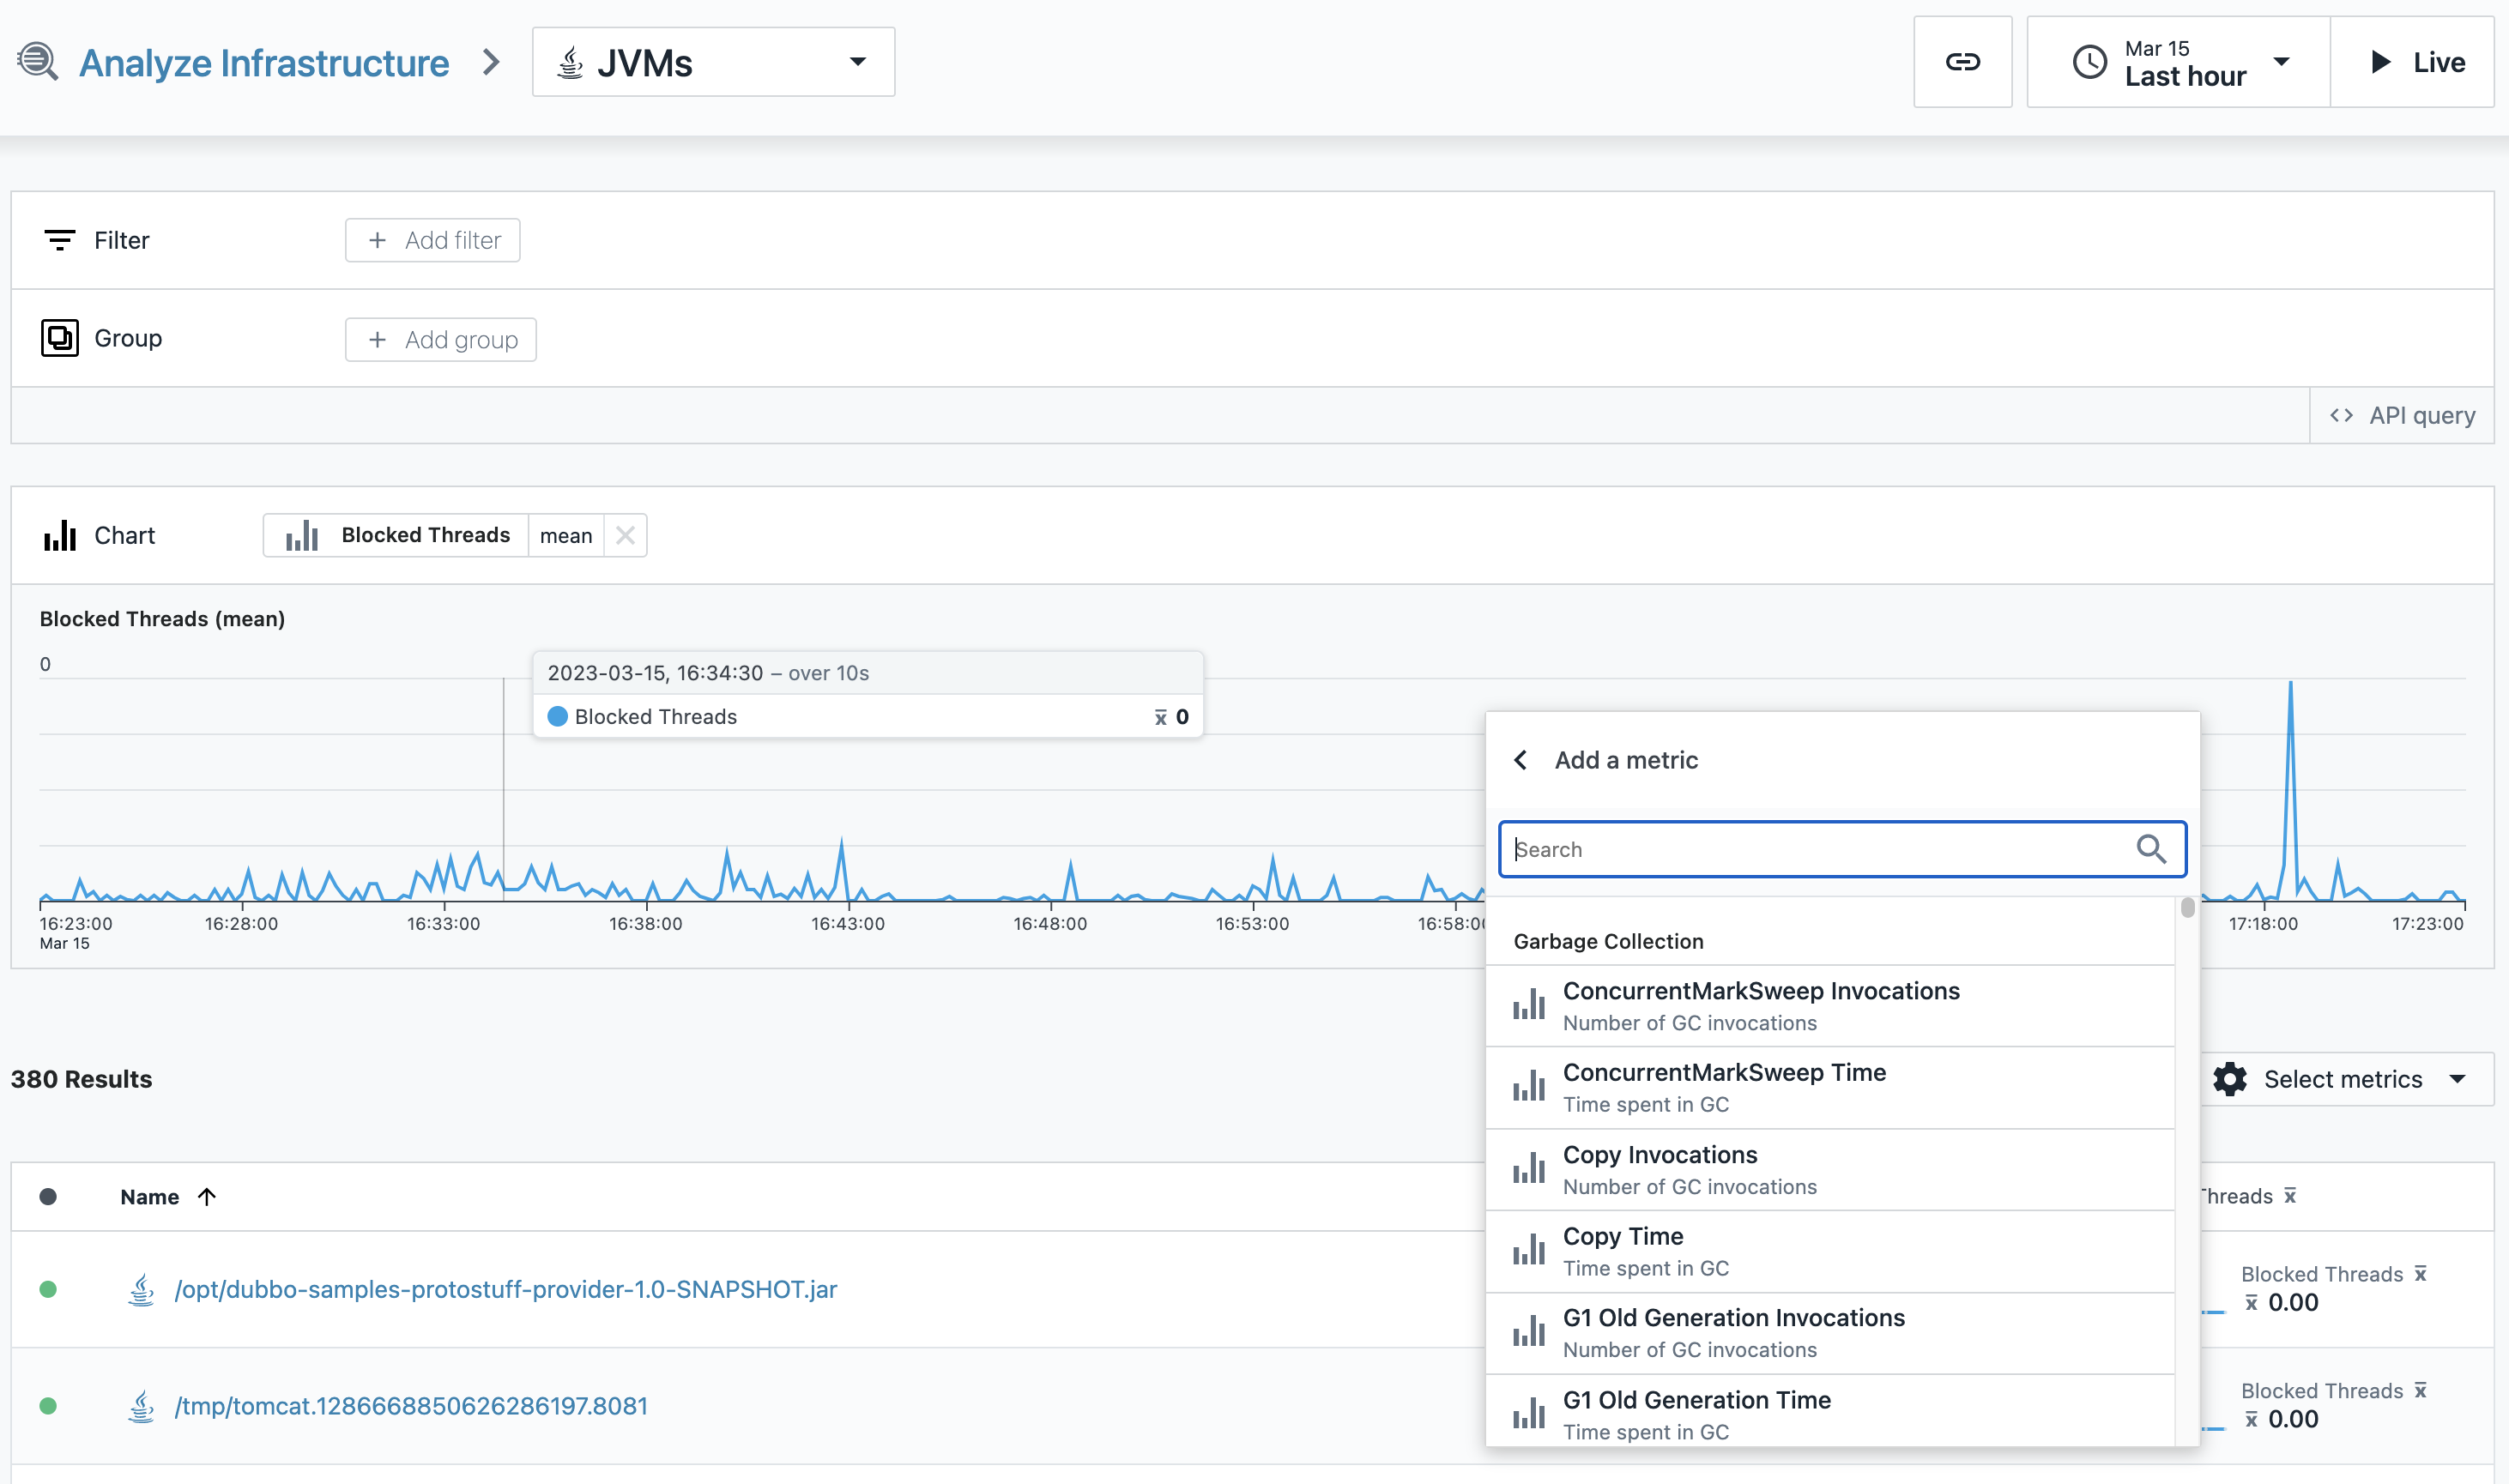
-
Reorder or remove metrics.

See the following example result:

Export metrics
You can save the infrastructure entity and group metrics to a CSV (comma-separated values) file by clicking Export to CSV. The maximum number of rows that can be exported is 10,000.

Filter and group entities
You can filter and group the infrastructure entity list further by clicking either Add filter or Add group respectively and specifying the metrics or tags to filter on or group by.
-
Select one or more tags to use as filters.

-
Select a tag to use for grouping.

See the following example result:

If you specify a tag that does not exist in the list of
entities, a No data available message will be
displayed. In this case, remove the filter or group that caused no
data to be displayed.
Exploration chart
For further entities exploration, you can select a chart metric to display its values across all filtered entities.
-
Select one chart metric.

-
Explore the metric across all filtered entities.

Launch an entity dashboard
Click an infrastructure entity, and then you can see the specific dashboard for that entity, which enables further exploration and deep dive analysis.

Select a different entity type
You can select a different infrastructure entity type by using the drop-down menu. Click the Analyze Infrastructure link near the drop-down menu, and then you can see the initial analyze infrastructure page that shows the list of infrastructure entity types.

Limitations
- Analyze Infrastructure does not support viewing metrics for more than 10k groups or 10k entities. You can use filters to narrow down your query to a sub-set of monitored infrastructure.
- Analyze Infrastructure does not support granular RBAC control, but you can disable the entire view for a group with the analyze infrastructure group permission.