Single cell widget is now a visualization type
The single cell widget is now a visualization type and has several new capabilities. You can create a single cell visualization and convert it to a view (exploration) or another visualization and vice versa.
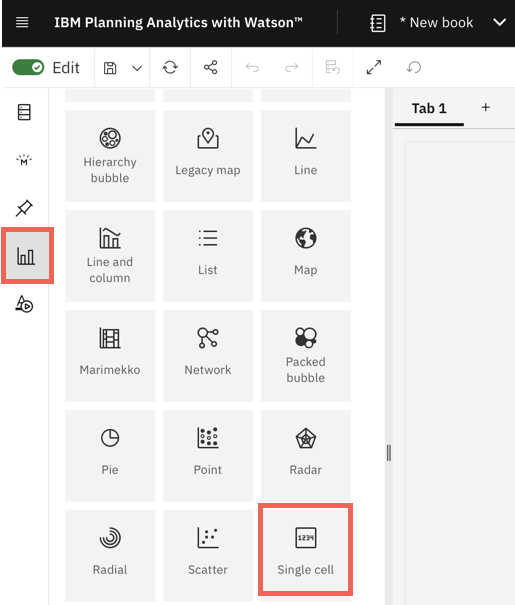
Like any other visualization, you can add a Single cell visualization to your book from Visualizations and drag a cube or view on to the template.
When you select the Single cell visualization and go to the Fields tab, you can see dimensions and filters in their appropriate fields. You can also change the color palette for any conditional rules applied to the visualization and enable automatic refresh under the Visualization tab under Properties. Previously, fields and visualization properties were not available for the single cell widget.
You can convert Single cell to another visualization or an exploration and vice versa. When you convert another visualization or view to a Single cell visualization, Single cell displays data from the first cell.
The new cell alignment option is also available for Single cell visualizations. Right-click a Single cell visualization to see cell alignment and other formatting options for the visualization.