Custom diagram
A custom diagram is a strategy map where you import a custom image and show metrics with dimensional context onto the image as data points.
These examples of a custom diagrams are available:
- Geographical maps
- To show a regional focus of your organization.
- Process diagrams
- Show metrics in context of a process flow.
A custom diagram displays the metric and context dimension names with traffic light and trend indicator icons as an overlay or layer on the selected image.
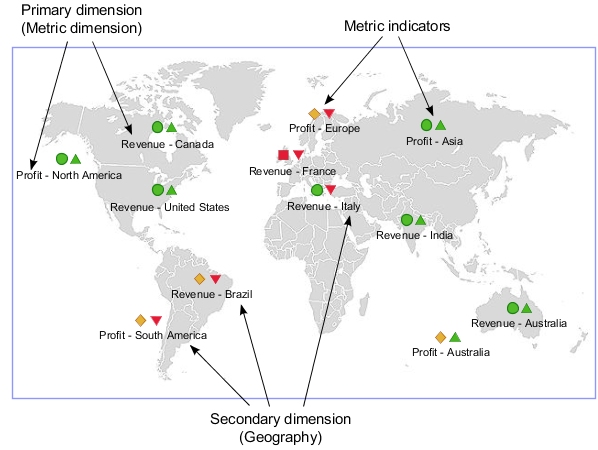
Dimensions for a custom diagram
To create a custom diagram, first select an image and then choose the dimensions and dimension context that you want to use in the diagram.
- Primary dimension (required)
- Secondary dimension (optional)
- Secondary dimension context (optional)
Sample images
These images are available in the custom diagram editor:
- World map for use with a geographic dimension.
- Process flow chart.
- Organization chart.
Image file types
You can use any of the
following image file types in a custom diagram:
- PNG
- GIF
- BMP
- JPEG
Image properties
You can edit the properties for the image size and opacity.