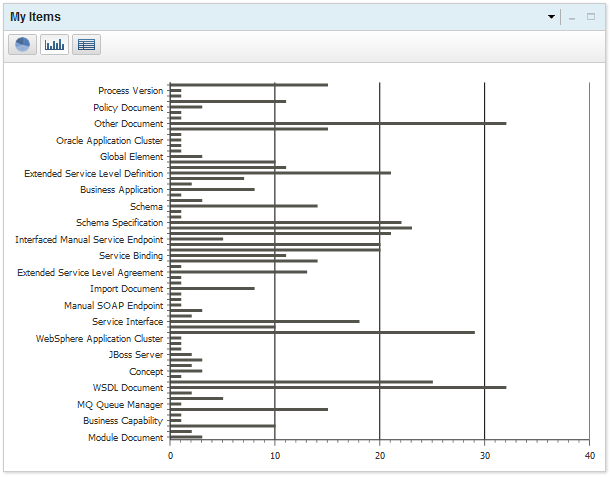
Chart widget
Use the Chart widget to display a collection of service registry items in the form of a pie chart, bar chart, or table.
Click the pie, bar, or table icons to display the data in a different format.
The Chart view drop-down list filters
the specific types of items that are used to generate the report,
as described in the following table. The options available depend
on the chart type that the Chart widget has been configured to display.
- Chart view drop-down list
- Filters the specific types of items that are used to generate the report.
-
Table 1. Chart view filter options Chart Type View Options Endpoints by Environment - Service Endpoint
- REST Service Endpoint
- MQ Service Endpoint
- SCA Service Endpoint
- Interfaced Manual Service Endpoint
- Extension Service Endpoint
- SOAP Service Endpoint
Number of Versions per Business Capability - Business Capability
- Business Process
- Business Application
- Business Service
Online/Offline Endpoints per Environment - All Environments
- Production
- Development
- Staging
- Test
SLAs Activated in the Last Year - Service Level Agreement
- Extended Service Level Agreement
SLAs by Governance State - Service Level Agreement
- Extended Service Level Agreement
SLAs Deactivated in the Last Year - Service Level Agreement
- Extended Service Level Agreement
SLDs by Governance State - Service Level Definition
- Extended Service Level Definition
Versions by Governance State - Capability Version
- Application Version
- Process Version
- Service Version
Service Consumption by Version - Capability Version
- Application Version
- Process Version
- Service Version
Services by Governance State - Capability Version
- Application Version
- Process Version
- Service Version
Services by Owning Organization - Business Capability
- Business Process
- Business Application
- Business Service
Services Deployed to Production in the Last Year - Capability Version
- Application Version
- Process Version
- Service Version
Services Deployed to Staging in the Last Year - Capability Version
- Application Version
- Process Version
- Service Version
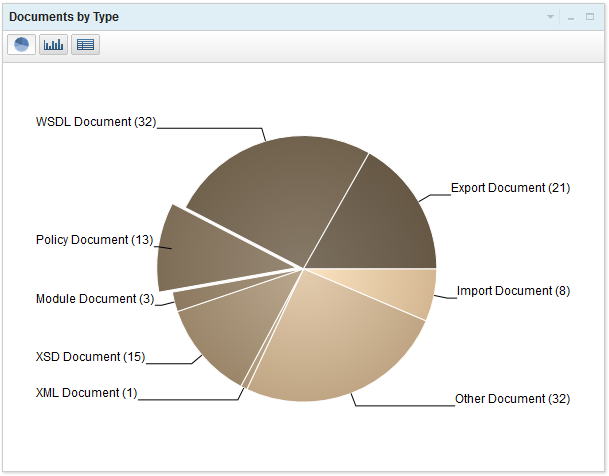
Example
Here is an example of the Chart widget that displays the Documents By Type as a pie chart: