Run a Python notebook to generate results in Watson OpenScale
In this tutorial, you learn to run a Python notebook to create, train, and deploy a machine learning model. Then, you create a data mart, configure performance, accuracy, and fairness monitors, and create data to monitor. Finally, you will be able to view results in the Watson OpenScale Insights tab.
Scenario
Traditional lenders are under pressure to expand their digital portfolio of financial services to a larger and more diverse audience, which requires a new approach to credit risk modeling. Their data science teams currently rely on standard modeling techniques - like decision trees and logistic regression - which work well for moderate data sets, and make recommendations that can be easily explained. This approach satisfies regulatory requirements that credit lending decisions must be transparent and explainable.
To provide credit access to a wider and riskier population, applicant credit histories must expand. They go beyond traditional credit, such as mortgages and car loans, to alternate credit sources, such as utility and mobile phone plan payment histories, education, and job titles. These new data sources offer promise, but also introduce risk by increasing the likelihood of unexpected correlations, which introduce bias based on an applicant’s age, gender, or other personal traits.
The data science techniques that are most suited to these diverse data sets, such as gradient boosted trees and neural networks, can generate highly accurate risk models, but at a cost. Such models, without understanding the inner workings, generate opaque predictions that must somehow become transparent. You must ensure regulatory approval, such as Article 22 of the General Data Protection Regulation (GDPR) or the federal Fair Credit Reporting Act (FCRA) that is managed by the Consumer Financial Protection Bureau.
The credit risk model that is provided in this tutorial uses a training data set that contains 20 attributes about each loan applicant. Two of those attributes - age and sex - can be tested for bias. For this tutorial, the focus is on bias against sex and age. For more information about training data, see Why does Watson OpenScale need access to my training data?
Watson OpenScale monitors the deployed model's propensity for a favorable outcome ("No Risk") for one group (the Reference Group) over another (the Monitored Group). In this tutorial, the Monitored Group for sex is female,
while the Monitored Group for age is 18 to 25.
Before you begin
This tutorial uses a Jupyter Notebook that must be run in a Watson Studio project, that uses a "Python 3.5 with Spark" runtime environment. It requires service credentials for the following IBM Cloud services:
-
Watson OpenScale
-
IBM Watson Machine Learning
You must associate a Machine Learning instance if you do not already have one associated with your account. If you have a machine learning service that was provisioned as part of your IBM Cloud Pak for Data installation you can use it.
-
Db2 Warehouse
You must associate a Db2 Warehouse service with your account if you do not already have one. If you have a Db2 instance that was provisioned as part of your IBM Cloud Pak for Data installation you can use it.
When you choose a plan for each of the preceding Cloud Pak for Data services, there are several options, including a Lite plan. Although the Lite plan is free, it is restricted and provides only enough processing to run through the tutorial a couple of times before the monthly limit is reached.
Introduction
Use the Jupyter notebook to train, create and deploy a German credit risk model, configure Watson OpenScale to monitor that deployment, and provide seven days' worth of historical records and measurements for viewing in the Watson OpenScale Insights dashboard.
Create and deploy a machine learning model
Add the Working with Watson Machine Learning notebook to your Watson Studio project
-
Access the following file. If you have a GitHub account, you can sign in to clone the repository and download the file. Otherwise, you can view the raw version, by clicking the Raw button and copy the text of the file into a new file with the extension
.ipynb. -
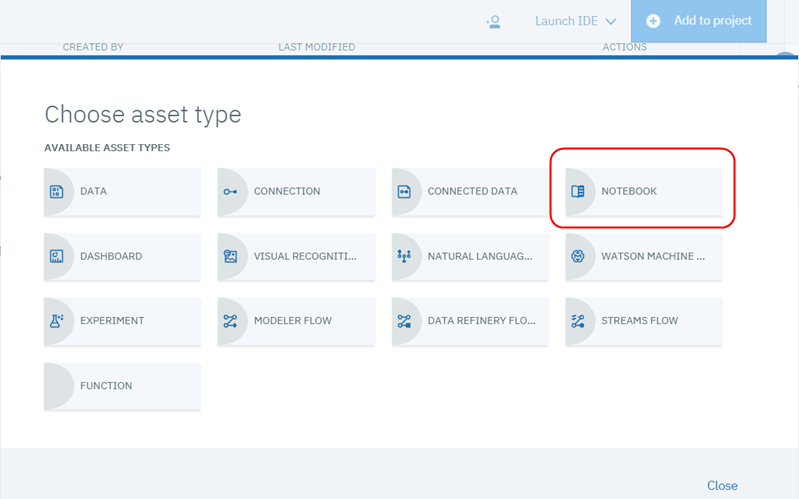
From the Assets tab in your Watson Studio project, click the Add to project button and select Notebook from the dropdown:
-
Select From file:

-
Then, upload the file:

-
In the Select runtime section, choose the latest Python with Spark option.
Watson Studio does not offer a free environment with Python and Apache Spark. The only free runtime environment is for a Python-only environment.
-
Click Create.
Edit and run the Working with Watson Machine Learning notebook
The Working with Watson Machine Learning notebook contains detailed instructions for each step in the Python code you run. As you work through the notebook, take some time to understand what each command is doing.
-
From the Assets tab in your Watson Studio project, click the Edit icon next to the
Working with Watson Machine Learningnotebook to edit it. -
In the "Provision services and configure credentials" section, make the following changes:
-
Follow the instructions in the notebook to create, copy, and paste an IBM Cloud API key.
-
Replace the IBM Watson Machine Learning service credentials with the ones you created previously.
-
Replace the DB credentials with the ones you created for Databases for PostgreSQL.
-
If you previously configured Watson OpenScale to use a free internal PostgreSQL database as your data mart, you can switch to a new data mart that uses your Databases for PostgreSQL service. To delete your old PostgreSQL configuration and create a new one, set the KEEP_MY_INTERNAL_POSTGRES variable to
False.The notebook removes your existing internal PostgreSQL data mart and create a new data mart with the supplied DB credentials. No data migration occurs.
-
-
After you provision your services and entered your credentials, your notebook is ready to run. Click the Kernel menu item, and select Restart & Clear Output from the menu:

-
Now, run each step of the notebook in sequence. Notice what is happening at each step, as described. Complete all the steps, up through and including the steps in the "Additional data to help debugging" section.
The net result is that you have created, trained, and deployed the Spark German Risk Deployment model to your Watson OpenScale service instance. Watson OpenScale is configured to check the model for bias against sex (in this case, Female) or age (in this case, 18-25 years old).
View results
View insights for your deployment
Using the Watson OpenScale dashboard, click the Insights  tab:
tab:
The Insights Dashboard page provides an overview of metrics for your deployed models. You can easily see alerts for Fairness or Accuracy metrics that exceed the threshold set through the notebook. The data and settings that are used in this tutorial create Accuracy and Fairness metrics similar to the ones shown here.

View monitoring data for your deployment
- From the Insights Dashboard page, click the tile that corresponds to your deployment to view monitoring data.
The model deployment page displays data for the fairness, quality, and drift monitors. - Click one of the monitor tiles to view evaluation metrics for the monitored attributes.
A chart displays aggregated evaluations as data points across the timeline that you specify. - For any monitored attribute, slide the marker across the chart to select data for a specific timestamp.
-
Click a data point on the chart to view details about the monitoring data.

Now, you can review the data that you monitored. For the following example, you can see that, for the Sex attribute, the monitored group received favorable outcomes less often than the reference group.

View explainability for a model transaction
For each deployment, you can see explainability data for specific transactions. If you already know which transaction you want to view, you can find it with the transaction ID.
-
Click the Explain a transaction
 tab in the navigator.
 -
Select a model in the Deployed model list.
The Recent transactions list displays all of the transactions that are processed by your model. The list contains columns that provide details about the outcome of each transaction.
-
Enter a transaction ID.
If you use the internal lite version of PostgreSQL, you might not be able to retrieve your database credentials. This might prevent you from seeing transactions. -
Click the Explain button in the Actions column.
The Transaction details page provides an analysis of the factors that influenced the outcome of the transaction.
-
Optional: For further analysis, click the Inspect tab.
You can set new values to determine a different predicted outcome for the transaction. -
Optional: After you set new values, click Run analysis to show how different values can change the outcome of the transaction.

Next steps
- Learn more about viewing and interpreting the data and monitoring explainability.
Parent topic: Watson OpenScale