Mainframe Reports
The Mainframe collection provides a comprehensive and defensible view of mainframe total cost of ownership, consumption, utilization, and allocation. It brings together financial, operational, and workload-level insights to help organizations understand where mainframe costs originate, how they are consumed, and how they can be accurately allocated to applications and business units.
This collection enables IT and finance leaders to analyze mainframe costs alongside consumption metrics such as GCP and zIIP MSUs, track trends over time, compare usage to business volumes, and identify inefficiencies or anomalies. By combining cost transparency, unit-cost analysis, and utilization insights, the collection supports informed decision-making around optimization, capacity planning, and funding models.
The reports in this collection support cost accountability through transparent showback and chargeback views, help validate cost structures against benchmarks, and provide visibility into workload efficiency and long-term consumption trends. Together, they enable organizations to confidently communicate mainframe TCO, defend budgets, and drive continuous efficiency improvements.
Reports available in this collection include:
- Mainframe TCO – Cost Transparency & Allocation
- Mainframe TCO – Cost Pool Composition & Peer Comparison
- Mainframe Analysis
- Mainframe Application
- Mainframe Utilization
- Mainframe Showback & Chargeback
- Mainframe TCO - Mainframe Utilization & Efficiency Insights
- Mainframe TCO – Model View
Mainframe TCO - Cost Transparency & Allocation
This report provides a comprehensive view of total mainframe cost and consumption by combining costs, GCP/zIIP MSUs, and calculated unit costs in one integrated view.
Use this report to understand the complete mainframe cost picture, identify major cost drivers, and communicate TCO to stakeholders. The report breaks down spending across labor, vendors to pinpoint optimization opportunities.
This report is designed for use by the following roles:
- CIO and IT Leadership
- Mainframe Cost Center Owner
- IT Finance
Insights Provided:
- Comprehensive view of total cost and consumption combining costs, GCP/zIIP MSUs, and calculated unit costs.
- Understanding of cost and usage trends over time.
- Breakdown of key cost drivers across labor, vendors to pinpoint optimization opportunities.

Mainframe TCO - Cost Pool Composition & Peer Comparison
This report provides a detailed breakdown of mainframe TCO across key cost pools including hardware, software, labor, facilities, and outside services. Industry benchmark percentages are overlaid to highlight how your cost structure compares to industry norms.
Use this report to identify potential cost optimization areas, validate budget assumptions, and support strategic improvement initiatives. The peer comparison enables evidence-based discussions about mainframe cost structure.
This report is designed for use by the following roles:
- CIO and IT Leadership
- IT Finance
- Mainframe Cost Center Owner
Insights Provided:
- Detailed breakdown of mainframe TCO across hardware, software, labor, facilities, and outside services cost pools.
- Benchmark percentages overlaid to show how cost structure compares to industry norms and peer organizations.
- Identification of cost pools where spend is significantly above or below industry benchmarks.
- Support for strategic improvement initiatives through evidence-based cost structure analysis.

Mainframe Analysis
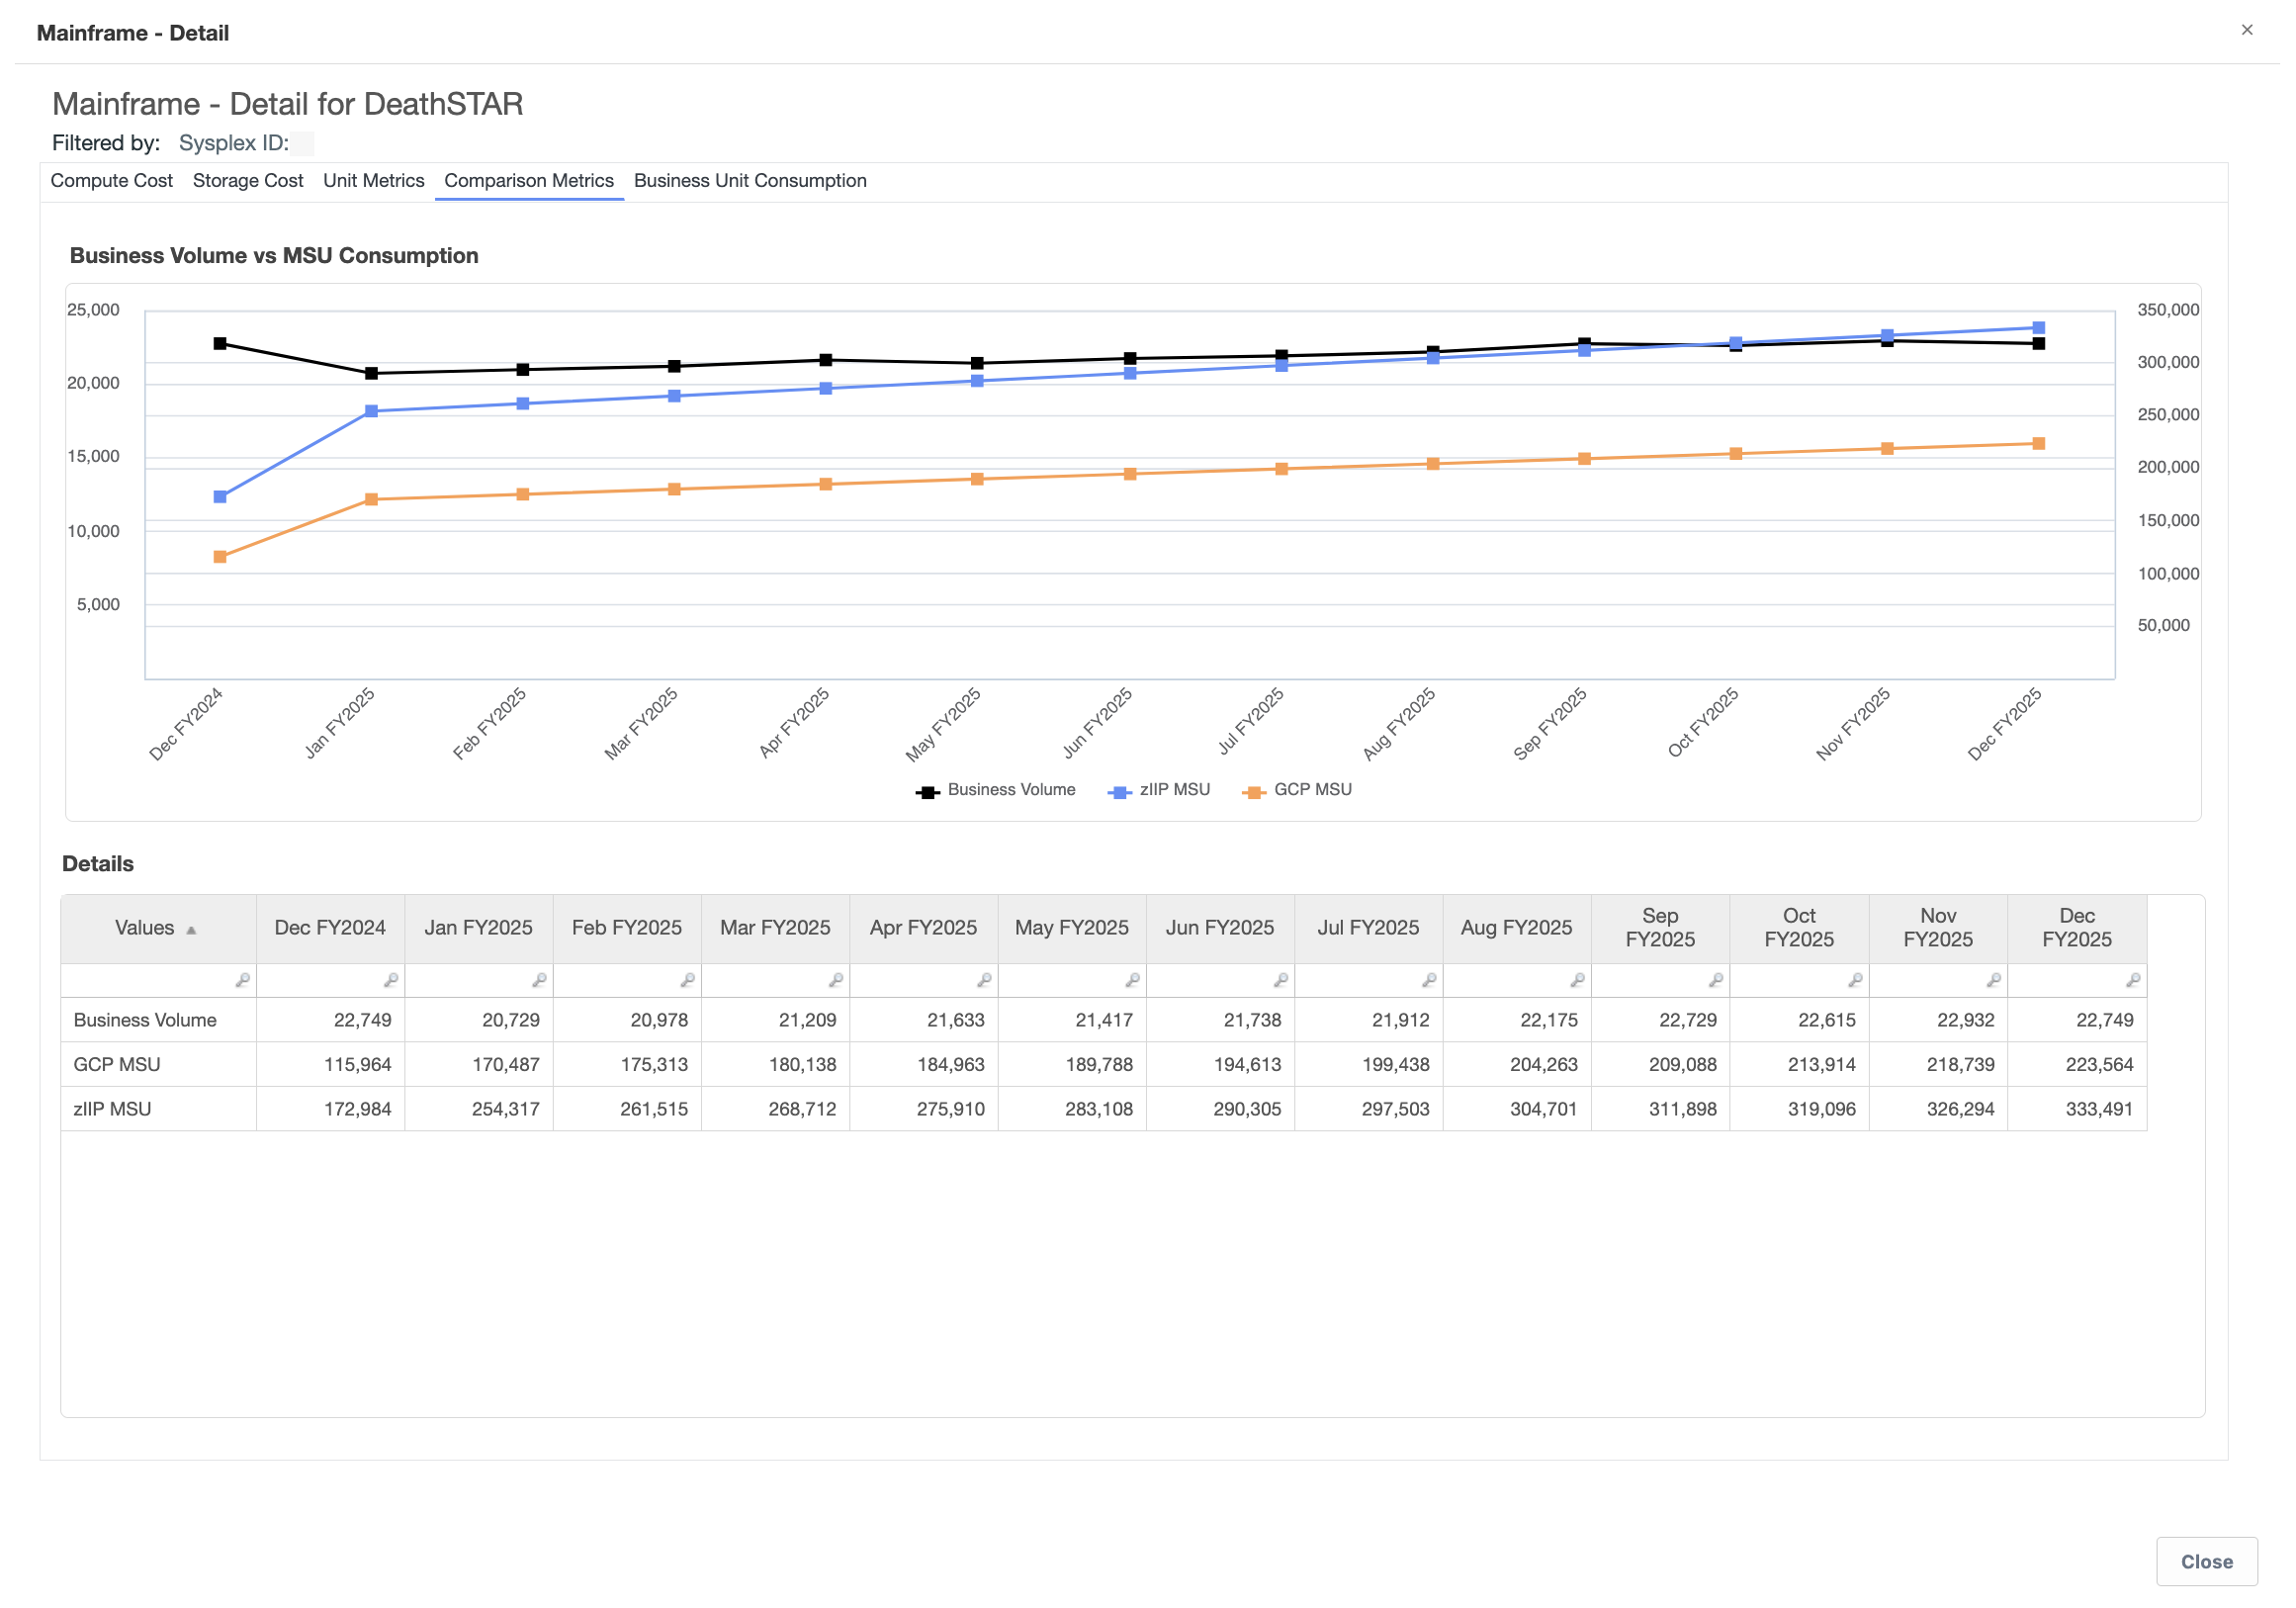
This report provides flexible analysis of mainframe costs and consumption using customizable filters, dimensions, metrics, and time periods. The report enables viewing of both GCP and zIIP MSU consumption to compare different types of workload processing.
Use this report for detailed analysis of cost and consumption patterns across various dimensions and time periods. The flexible format supports export for further analysis in other tools or dashboards.
This report is designed for use by the following roles:
- Mainframe Cost Center Owner
- IT Finance
- Capacity Planning
Insights Provided:
- View mainframe costs and consumption in flexible table format using filters and optional dimensions, metrics, and time.
- Consumption analysis for both GCP and zIIP MSU to compare different types of workload processing.
- Trend analysis across various time periods including monthly, quarterly, or custom ranges for reporting.
- Export capability for further analysis in other tools or dashboards.

Mainframe Application
This report provides a comprehensive view of mainframe-backed applications, combining application-level costs, business volumes, unit costs, and mainframe consumption metrics (GCP and zIIP MSUs) into a single integrated view. It enables organizations to understand how mainframe resources are consumed by individual applications and how those costs translate into business value.
- CIO and IT Leadership
- Mainframe Cost Center Owner
- Application Owners
- View application-level total cost, cost YTD, GCP MSU, and zIIP MSU consumption in a single integrated view.
- Understand unit cost by business volume (e.g., cost per order, cost per account, cost per transaction).
- Analyze spend by application family, investment objective, and lifecycle stage (Invest, Migrate, Tolerate, Eliminate).
- Identify high-cost or high-consumption applications to prioritize optimization, modernization, or retirement decisions.

Mainframe Utilization
This report tracks MSU consumption trends by workload category, workload type, product line name, product name, and application name. The report highlights significant month-over-month changes and provides quarter-over-quarter and year-over-year views for long-term trend analysis.
Use this report to monitor workload consumption patterns, identify utilization anomalies, and track long-term consumption trends. The conditional highlighting draws attention to significant changes that may require investigation.
This report is designed for use by the following roles:
- Capacity Planning
- Application Owner
- Mainframe Cost Center Owner
Insights Provided:
- MSU consumption trends by workload category showing usage across different types of processing.
- Usage tracking by workload type, product line name, product name, and application name for detailed analysis.
- Month-over-month MSU consumption monitoring with conditional highlights identifying significant changes.
- Quarter-over-quarter and year-over-year views to understand long-term consumption trends.

Mainframe Showback & Chargeback
This report connects mainframe usage to costs by application, workload, or business unit using actual consumption data. The report ensures cost allocation reflects true consumption through integration with IBM IntelliMagic Vision data.
Use this report to provide clear, defensible showback and chargeback views to business units. The data-driven approach makes cost discussions productive by grounding them in actual usage metrics.
This report is designed for use by the following roles:
- Business Relationship Manager
- IT Finance
- Application Owner
Insights Provided:
- Connection of mainframe usage to costs by application, workload, or business unit based on actual consumption.
- Cost allocation that reflects true consumption using IBM IntelliMagic Vision data for accuracy.
- Clear, defensible showback and chargeback views for business units with transparent methodologies.
- Data-driven cost discussions grounded in actual usage metrics and consumption patterns.

Mainframe TCO - Mainframe Utilization & Efficiency Insights
This report identifies mainframe efficiencies through workload-level utilization insights that reveal patterns, spikes, and underused capacity. The report tracks all workloads and applications currently active on the mainframe along with their MSU consumption.
Use this report to inform smarter planning and usage decisions by identifying inefficiencies, tracking consumption trends, and spotting workload spikes. The detailed visibility supports operational efficiency improvements.
This report is designed for use by the following roles:
- Capacity Planning
- Application Owner
- Mainframe Cost Center Owner
Insights Provided:
- Identification of mainframe efficiencies through workload-level utilization insights revealing patterns, spikes, and underused capacity.
- Tracking of all workloads and applications currently active on the mainframe along with their MSU consumption.
- Consumption trend tracking by workload type, product line, and application to identify inefficiencies.
- Workload spike tracking and identification of opportunities to improve operational efficiency.
Mainframe TCO - Model View
This report visualizes the complete cost flow from beginning to end in the mainframe cost model. The report traces underlying cost drivers feeding into the mainframe processor including direct costs from the General Ledger such as depreciation, as well as labor and vendor costs.
Use this report to understand how costs flow through the model and how usage data drives the allocation of mainframe TCO to business applications. The visualization supports validation of allocation methodologies and cost model accuracy.
This report is designed for use by the following roles:
- IT Finance
- Mainframe Cost Center Owner
- TBM Office
Insights Provided:
- Visualization of cost flow from beginning to end in the mainframe cost model.
- Tracing of underlying cost drivers feeding into the mainframe processor including direct costs from General Ledger.
- Understanding of how labor and vendor costs contribute to total mainframe TCO.
- Visualization of how usage data drives the allocation of mainframe TCO to business applications.
