IBM Cognos Analytics 11 integration
IBM® Cognos® Analytics integrates reporting, modeling, analysis, dashboards, stories, and event management so you can understand your organization's data, and make effective business decisions. Cognos Analytics reporting and dashboarding features help virtually anyone help virtually anyone can use to create informative, engaging visualizations without needing help from IT.
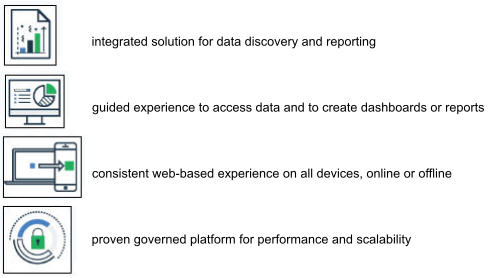
Experience IBM Cognos Analytics, an interactive way for virtually anyone to find, explore, and share data-driven insights in a governed environment. Find precise and timely answers from your data or from content built by others. Create compelling reports and dashboards, which you can easily distribute throughout your company. Use automated alerts to monitor changes to key findings. And confidently and quickly take actions to improve your business.
Key benefits of IBM Cognos Analytics include
- a contextualized smart search
- an intuitive interface that helps all users quickly author content
- dashboards that can be created using drag-and-drop on a mobile device or the desktop
- a tool to automatically recommend the best visualizations to be used for particular data
- templates and styles (which will let you format reports instantly)
- on-demand menus that provide access to full capabilities over a clean workspace
- a single interface for creating ad hoc or pixel-perfect reports, freeing up IT skilled resources
Integration with IBM Cognos Analytics, together with the reporting framework enhancements, combine to form a powerful capability for end users to create their own reports. In addition, a new application permission allows you to control end-user access to a single IBM Cognos Analytics reporting menu item.