Example: Implementing BPM alerts
This example shows how to use the BPM Alert REST APIs to create a dashboard in the Process Admin console that displays when the number of process instances or tasks triggers an alert.
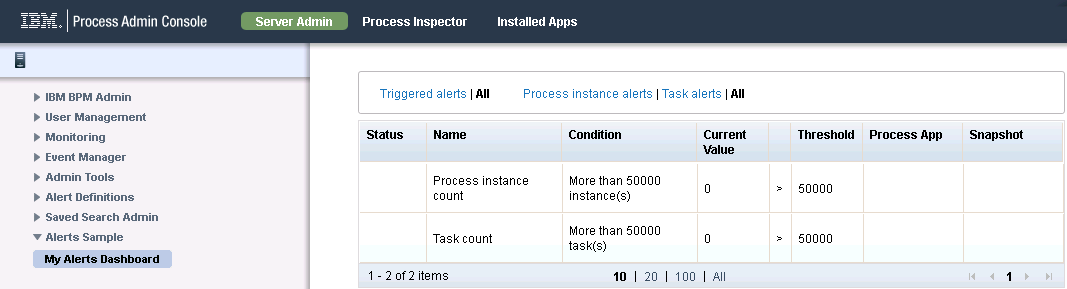
The example consists a business object to contain the alert information, an integration service to call JavaScript APIs to retrieve the alert information, and a user interface to display the alerts in the Process Admin Console. The dashboard looks like the following screen capture:
This example is just one way that you can make administrators aware of when the number of process instances or tasks fall below, reach, or exceed a specified threshold value. For example, you can use the APIs to create emails that are sent to administrators or create a web page that administrators can access outside of the Process Admin Console.
Create the alert business object
In the sample, AlertStatusSummary business object contains information about alert definitions that the user sees in the dashboard.
The example dashboard uses a table with each row representing a different alert definition through a different instance of AlertStatusSummary.
- In Process Center, create the Alerts Sample process application to contain the dashboard artifacts.
- Open the new process application in Process Designer.
- Add the Dashboards toolkit as a dependency. The dashboard uses a number of coach views and other resources in this toolkit to manage its refresh behavior and for the filters.
- Create the AlertStatusSummary business object.
- Set its definition type to Complex Structure Type and
add the following parameters to it:
Parameter name Description status(String) Whether an alert has been triggered for this alert definition, or some other status displayName(String) The name of the alert definition that is visible to users. condition(String) The expression that determines whether the actual value of the monitored parameter exceeds the threshold value. currentValue(String) The value of the parameter that is being monitored thresholdOperator(String) Whether the attribute must be equal to, less than, or greater than the threshold value to trigger the alert. thresholdValue(String) The value that triggers the alert. projectDisplayName(String) The process application that is being monitored for alert conditions. snapshotDisplayName(String) The visible name for the process application snapshot that is being monitored for alert conditions. bpdDisplayName(String) The name for the BPD that is visible to users. instanceStatus(String) Whether an alert has been triggered for the process instance, or some other status. taskStatus(String) Whether an alert has been triggered for the task instance, or some other status.
Creating the integration service
In the sample, the integration service retrieves the list of alert definitions based on a filter.
In the sample, the user selects the filters through the following user interface on the dashboard:

- Create an integration service called Alert Definitions Status Retrieval Service.
- Add the following input variable:
- categoryFilter(String)(List)
The service accepts this input to determine which type of alert definitions to retrieve.
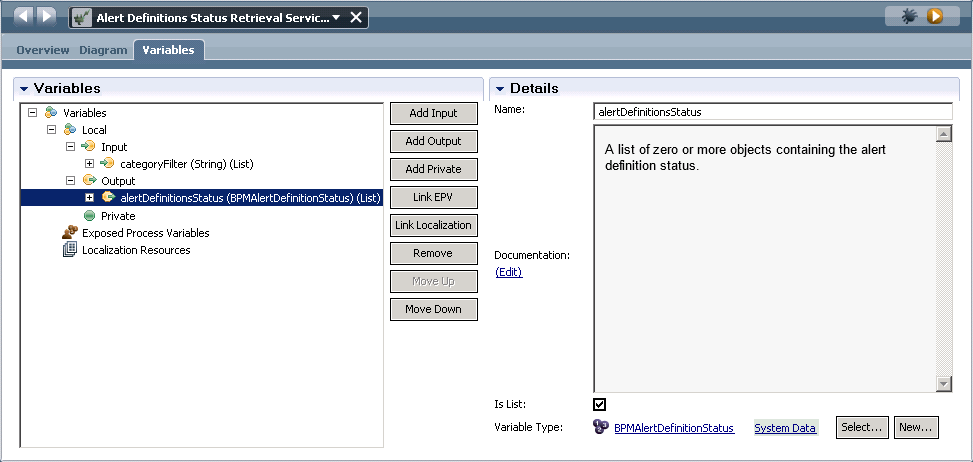
- Add the following output variable:
- alertDefinitionsStatus(BPMAlertDefinitionStatus)(List)
The output variable contains the list of alert definitions that the service retrieved based on the type of alerts that the user wants to see. The BPMAlertDefinitionStatus type is in the System Data toolkit to support BPM alerts.
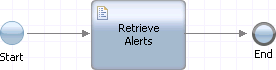
- In its diagram, add a server script called Retrieve
Alerts. Connect the start event to the server script and
then connect the server script to the end event.
- Select the server script and, in its Implementation properties
page, add code that does the following things:
- Determine the filter to apply.
- Retrieve the alert definitions that match the type filter and put them in a list.
- Retrieve which alert definitions have triggered an alert.
var ids = null;

// if categoryFilter is set, use it to get the alert definitions
if(tw.local.categoryFilter != null) {
	var alertDefinitions = tw.system.getAlertDefinitions(tw.local.categoryFilter, true);
	ids = new tw.object.listOf.String();
	for (var i=0; i<alertDefinitions.length; i++) {
		ids.insertIntoList(i, alertDefinitions[i].id);
}}

// get the status of the retrieved alert definitions
if(ids == null || ids.length > 0) {
	var alertStatusResponse = tw.system.getAlertDefinitionsStatus(ids, true);
	tw.local.alertDefinitionsStatus = alertStatusResponse.alertDefinitionStatus;
}
Create the human service to support the user interface
The sample uses a heritage human service to define the flow between the integration service and the user interface defined in a coach.
- Create a heritage human service called My Alerts Dashboard.
- Add the following private variables to the My Alerts Dashboard
human service:
Private Variable Default Value Description refresh(Boolean) Set to true to trigger a boundary event that calls the integration service to retrieve the alert definitions again. refreshInterval(Integer) 60 The number of seconds between refreshes categoryFilter(String)(List) The type of filter to use to retrieve alert definitions if the user has selected process instance alerts or task alerts. Valid values are "INSTANCE" or "TASK". This is optional and if it does not have a value, both types of alert definitions are retrieved. alertDefinitionsStatus(BPMAlertDefinitionStatus)(List) The status of the retrieved alert definitions such as whether they have been triggered. alertStatusSummaries(AlertStatusSummary)(List) The prepared list of alerts to display. selectedCategoryFilter(String) "" Whether the user wants to see the alert definitions for process instances, for tasks, or both. selectedTriggeredFilter(String) "true" Whether the user wants to see only alert definitions that have triggered an alert or all alert definitions. - In the human service diagram, add a nested service, two server
scripts, and a coach. Rename them using the information in the following
table:
Artifact New Name Nested service Retrieve Alert Definitions Server Script Map Status to AlertSummary Server Script (1) Eval category selection Coach My Alerts Dashboard - Select the nested service and then set its properties:
- In its Implementation properties, attach the Alert Definitions Status Retrieval Service that you created in the previous section.
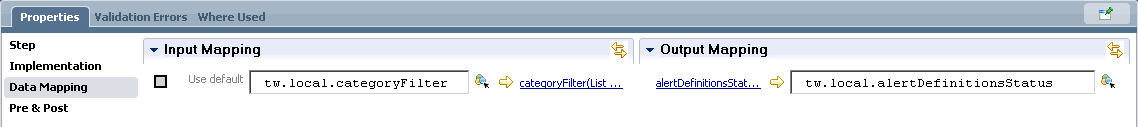
- In the input mapping of the Data Mapping properties, map the categoryFilter variable of the human service to the categoryFilter variable of the Alert Definitions Status Retrieval Service.
- Similarly, in the output mapping, map the alertDefinitionsStatus variable of the Alert Definitions Status Retrieval Service to the alertDefinitionsStatus variable of the human service.
- Select the Map Status to AlertSummary script
and then add code to its Implementation properties.
The code maps the AlertDefinitionsStatus objects
output by the Alert Definitions Status Retrieval Service to the local AlertStatusSummary business
object that you created earlier. The code also makes the condition
more readable by people.
tw.local.alertStatusSummaries = new tw.object.listOf.AlertStatusSummary(); var alerts = tw.local.alertDefinitionsStatus; // map the status to the alertStatusSummaries var num = 0; var numOfAlerts = 0; if(alerts != null) { for(var i=0; i<alerts.listLength; i++) { var status = alerts[i]; // map only if the alert status summary is needed if(status.conditionMet || tw.local.selectedTriggeredFilter == "true") { // build the AlertSummary var alertSummary = new tw.object.AlertStatusSummary(); alertSummary.currentValue = status.actualValue; alertSummary.displayName = status.definition.displayName; alertSummary.thresholdValue = status.definition.thresholdValue; // find the correct project name var project = null; var invalid = false; if(status.definition.projectId != null) { project = tw.system.model.findProcessAppByID(status.definition.projectId); if(project != null) { alertSummary.projectDisplayName = project.name; } else { alertSummary.projectDisplayName = status.definition.projectId; invalid = true; } } // find the correct snapshot name if(status.definition.snapshotId != null && project != null) { var snapshot = project.findSnapshotByID(status.definition.snapshotId); if(snapshot != null) { alertSummary.snapshotDisplayName = snapshot.name; } else { alertSummary.snapshotDisplayName = status.definition.snapshotId; invalid = true; } } // concatenate the condition summary if(status.definition.thresholdOperator == "GREATER") { alertSummary.condition = "More than "; alertSummary.thresholdOperator = ">" } else if (status.definition.thresholdOperator == "LESS") { alertSummary.condition = "Less than "; alertSummary.thresholdOperator = "<" } else { alertSummary.condition = "Exactly "; alertSummary.thresholdOperator = "="; } if(!invalid) { alertSummary.condition += status.definition.thresholdValue; alertSummary.condition += " " + status.definition.category.toLowerCase() + "(s)"; if(alertSummary.projectDisplayName != null) { alertSummary.condition += " in project '" + alertSummary.projectDisplayName + "'"; } if(alertSummary.snapshotDisplayName != null) { alertSummary.condition += " and snapshot '" + alertSummary.snapshotDisplayName + "'"; } } // if the alert is active or to display non-active alerts, add them to the list if(status.conditionMet) { alertSummary.status = "Triggered"; tw.local.alertStatusSummaries.insertIntoList(0, alertSummary); num++; numOfAlerts++; } else if (invalid) { alertSummary.condition = "This alert definition targets a process application or snapshot that is no longer available on the system."; alertSummary.status = "Invalid"; tw.local.alertStatusSummaries.insertIntoList(numOfAlerts, alertSummary); num++; numOfAlerts++; } else if (tw.local.selectedTriggeredFilter == "true") { tw.local.alertStatusSummaries.insertIntoList(num, alertSummary); num++; } } } } - Select the Eval category selection script and
then add code to its Implementation properties.
The code creates the overall filter used by the Alert Definitions
Status Retrieval Service as its input.
// if "All" category has been selected
if (tw.local.selectedCategoryFilter == "") {
    tw.local.categoryFilter = null;

// if another category has been selected, build the correct categoryFilter
} else {
    tw.local.categoryFilter = new tw.object.listOf.String();
    tw.local.categoryFilter.insertIntoList(0, tw.local.selectedCategoryFilter);
Create the user interface
The sample has a user interface that displays as a dashboard in the Process Admin Console.
- Create the filter user interface:
- Create a coach view called Alert Filter. The web Process Designer opens so that you can edit it.
- In the Overview page, select Can Fire Boundary Event.
- In the Behavior page, select the change event handler and add
the following code to it:
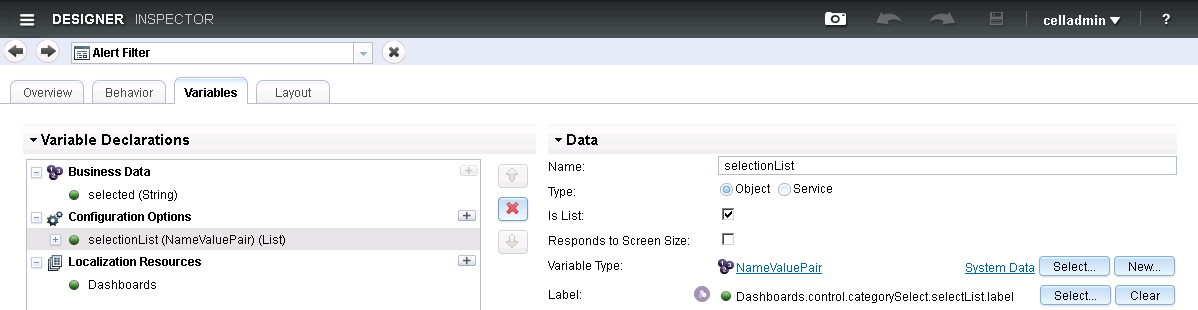
this.context.trigger(); - In the Variables page, add selected(String) as
business data, selectionList(NameValuePair)(List) as
a configuration option, and Dashboards as the localization resource.
The NameValuePair object is in the TWSYS toolkit
and the Dashboards localization resource is in the SYSD toolkit. If
you cannot see the NameValuePair object in the selection
list, select Show all business objects at the
bottom of the selection panel.
- In the Layout page, drop a Category Selection control from the palette onto the canvas.
- Bind the Category Selection control to the selected business data.
- Go back to the My Alerts Dashboard heritage human service in the desktop Process Designer. Open the Coaches page and select the My Alerts Dashboard coach.
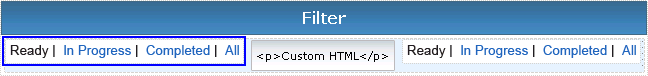
- In the My Alerts Dashboard, add a horizontal section and change its name to Filter.
- In the horizontal section, add two instances of the Alert Filter
coach views. Add a Custom HTML item between them.
- Select the first Alert Filter instance. In its General properties, bind the instance to the selectedTriggeredFilter variable. To distinguish between the boundary events broadcast by the Alert Filter instances, append triggeredFilter to the label.
- In its Configuration properties, expand Selection list.
Add the following name-value pairs:
Name Value Triggered alerts false All true The names are what the filter displays at run-time.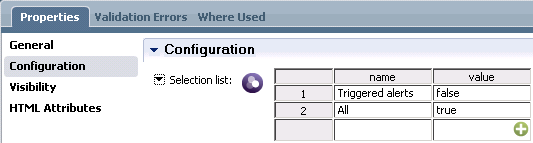
- Select the second Alert Filter instance. Bind it to the selectedCategoryFilter variable.
Append categoryFilter to its label. Add the
following name-value pairs:
Name Value Process instance alerts INSTANCE Task alerts TASK All - Select the Custom HTML item. Add the following HTML code:
The purpose of this control is to add some space between the two filters.<div id="spacer"> </div>
- Create the area to display the alert definitions:
- In the palette, open the Variables area. Drag the alertStatusSummaries variable onto the diagram. The diagram displays a table that contains a column for each parameter of the variable.
- To shorten the headings in the dashboard table, change the labels
for the following controls:
Default Control Label New Label Display name Name Threshold operator Threshold value Threshold Project display name Process App Snapshot display name Snapshot Bpd display name Process - For the Threshold operator control, set its label visibility to Hide.
- Add a Refresh Controller view and a Service Controller view to the diagram and bind them to the refresh variable. These views are mechanism to refresh the dashboard every 60 seconds.
- In the configuration properties of the Refresh Controller view, set its localization service to Dashboards Localized Messages Loader and set Time between refreshes to the refreshInterval variable.
Complete the dashboard
The sample has a user interface that displays as a dashboard in the Process Admin Console.
- In the My Alerts Dashboard diagram, make the following connections:
From To Start Retrieve Alert Definitions Retrieve Alert Definitions Map Status to AlertSummary Map Status to AlertSummary My Alerts Dashboard My Alerts Dashboard Retrieve Alert Definitions using the boundary event of the Service Controller My Alerts Dashboard Map Status to AlertSummary using the boundary event of the triggeredFilter Alert Filter My Alerts Dashboard Eval category selection using the boundary event of the categoryFilter Alert Filter Eval category selection Retrieve Alert Definitions 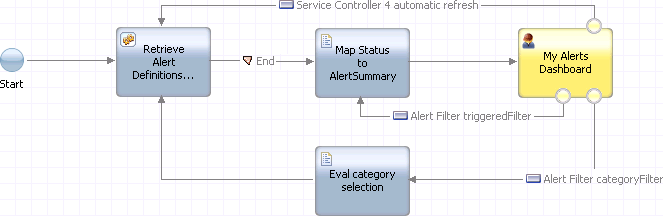
- In the Overview page, change Expose As to Administration Service. This makes the service visible in the Process Admin Console.