Line and column
Use a line and column visualization to show the relationship between two data sets by combining bars and lines in one visualization.
A line and column visualization presents the relationship between two data sets. By using a combination of different visualizations, each data set is better distinguished and you can combine data sets that vary widely in range.
Example
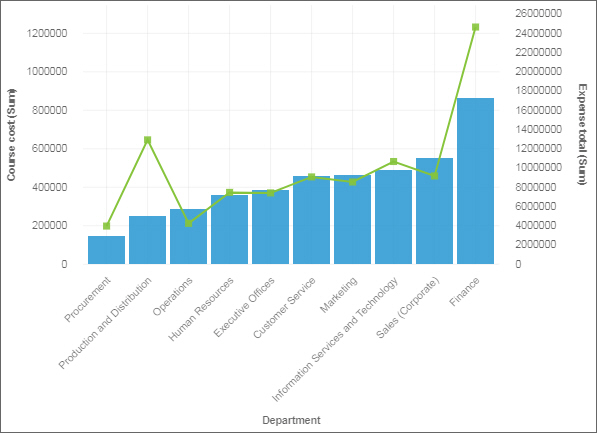
The following line and column visualization shows the course cost and corporate expenses by business departments. The column visualization indicates the course cost for each business department and the line visualization indicates the total corporate expenses of each department.